The authors are the winners of the U4 Proxy Challenge 2016. We need more imaginative ways of addressing corruption. It is important to generate indicators that development agencies can use. U4 and DFID developed a proxy challenge competition to inspire the research community to develop reliable, intuitive, accessible and cost-effective assessment methods that are useful across country-contexts.
How to measure company corruption risks
Recent scandals have brought to light the scale and diverse forms of abusing individual companies and extensive corporate networks for extracting corrupt rents and channelling them to opaque destinations. Private sector risk data providers and due diligence professionals have long recognised the importance of markers that signal the misuse of corporations for corrupt purposes. While no comprehensive review of company corruption proxies has existed until now, these diverse cases provide a rich basis for our systematic review. In addition, the increasing availability of micro-level company information from administrative registries allows the analysis of corruption risks at an unprecedented detail, yet country-wide scale. The proposed corruption proxies are objective in that they are not based on personal perceptions but factual data. They are also sensitive to change, meaning that they respond to policy changes, which allows for analysis of policy interventions unlike most governance indicators.
Corrupt exchanges involving companies often require the participation of public and business elites who can manage high value public decisions and can move large sums among business entities. Public decisions can concern, among others, public contracts, concessions (e.g. mining rights), specific regulations (e.g. protection from competition), or the sale of public property. Such high-level corruption is defined by the violation of the principles of impartial and open allocation of public resources in order to benefit a selected few to the detriment of others (Mungiu-Pippidi, 2015).
In order to adequately measure the corrupt misuse of corporate vehicles (a term that covers legal entities: corporations, trusts, foundations and partnerships with limited liability), it is not sufficient to analyse legal loopholes. One needs to grasp the exchanges they conduct with public bodies and the presence of conducive, suspicious company characteristics. Hence, the proposed measurement approach requires: First, identifying the full universe of potentially corruptible transactions (e.g. mining rights awarded). Second, identifying the companies that are likely used for corrupt rent extraction, rather than genuine economic exchange. The identification of corruption proxy indicators is challenging as corporate vehicles can be involved in corruption in multiple ways. Also, the types of company-state transactions vary greatly. This is why there is no simple way of determining whether such transactions are likely to indicate corruption. For example, profit ratios of high-risk companies can be both extremely low or high depending on whether excessive profits are reallocated in a company network or not. Therefore, instead of using a single corruption risk indicator, analysis should rely on multiple proxies, which are valid on their own while also allowing for triangulation against each other (e.g. overpriced bids on a public tender and opaque company ownership).
The quality of proposed objective corruption proxies crucially depends on the quality of administrative datasets (e.g. company registries), which is often questionable – especially in systematically corrupt countries. Triangulation of different indicators and data sources can reveal deliberate data errors, and also correct for some of them. However, it is often necessary for donors to independently collect data such as which companies receive donor-funded contracts.
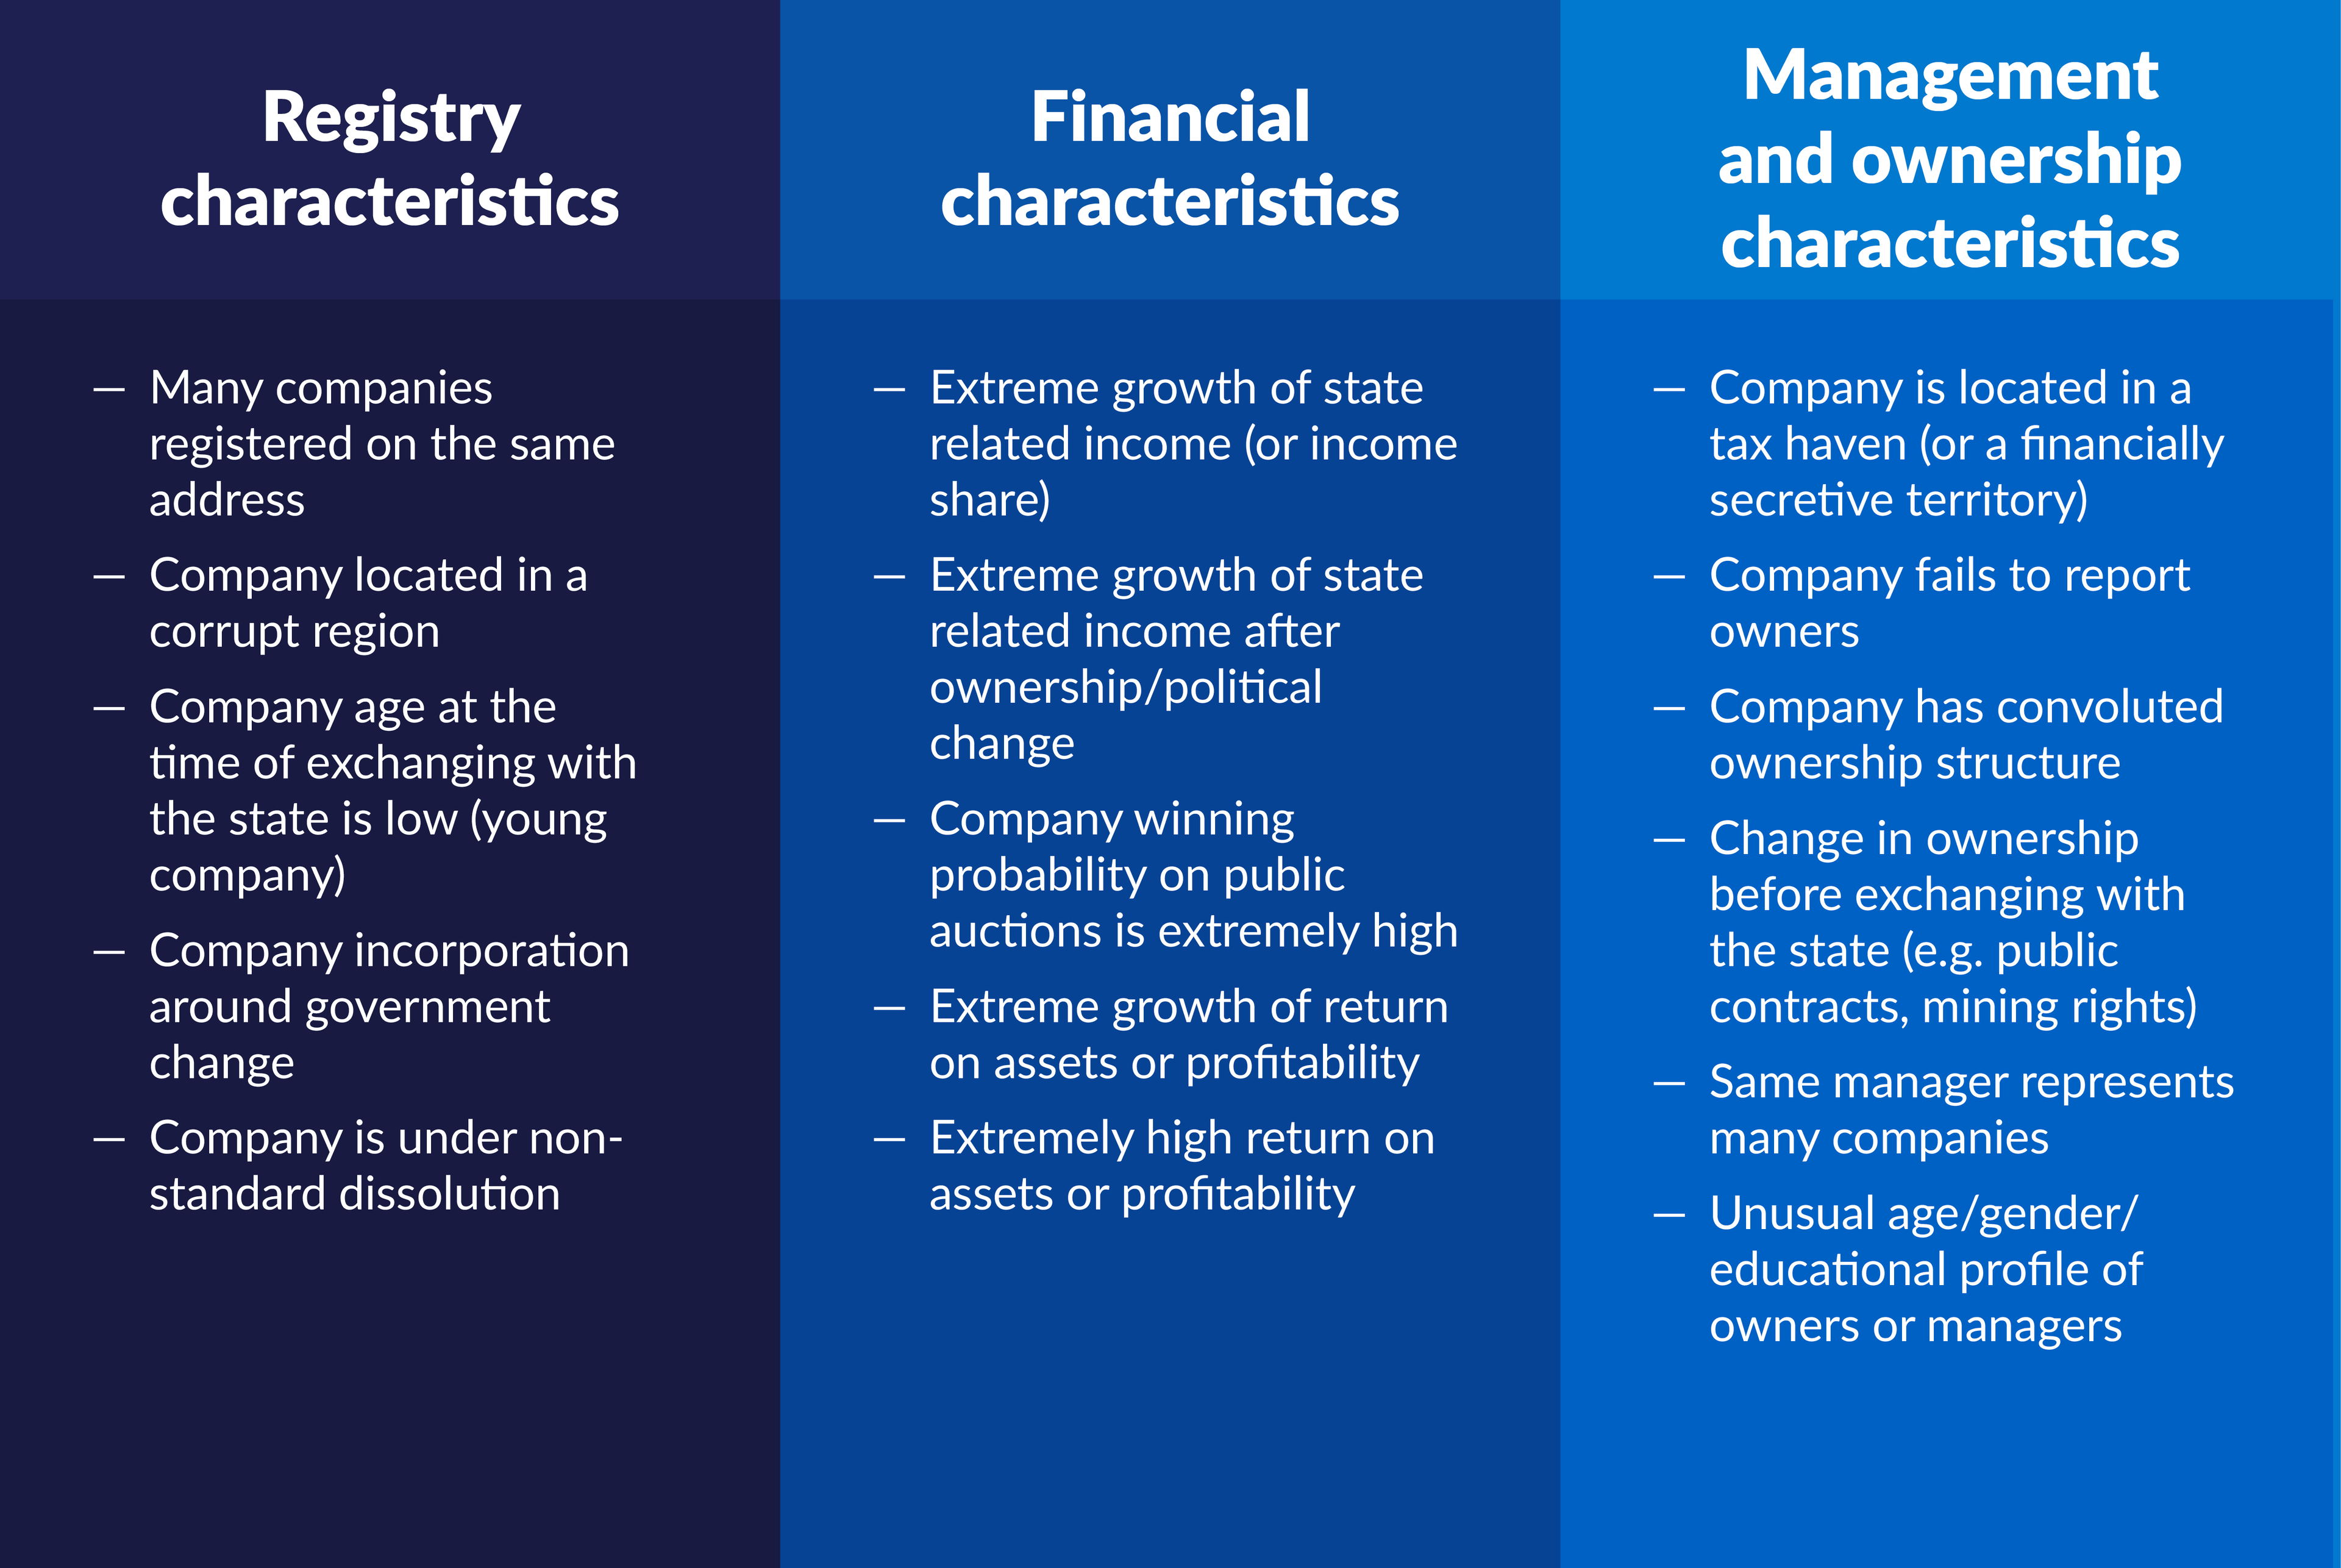
We propose three main company characteristics according to which individual company corruption risk indicators can be grouped: registry attributes, financial information, and ownership and management data. Selected indicators are listed in Table 1. For a comprehensive discussion see A comprehensive review of objective corruption proxies in public procurement: Risky actors, transactions, and vehicles of rent extraction.
Registry attributes
Registry attributes include the essential company characteristics such as location, size, or incorporation date. These attributes can only suggest that the company establishment is in some way anomalous compared to ‘clean’ businesses operating in a market. For example, case studies show that many of the companies involved in corrupt exchanges are registered at an address where a great number of other companies are also registered (Caneppele, Calderoni, & Martocchia, 2009).
Financial information
Financial information refers to the main annual financial data available in publicly released reports, such as turnover, profit rate, or return on assets. The evidence is mixed on whether corrupt companies have high or low financial performance. It depends both on the various motives behind the corrupt acts, and the methods used for rent-reallocation. Furthermore, extraordinary financial performance (e.g. high profit rates) can be driven by efficient companies, making interpretation more ambiguous. Nevertheless, both quantitative and qualitative evidence shows that corrupt exchanges are related to odd financial performance of connected companies.
Ownership and management data
Ownership and management data is possibly the most directly useful type of information for identifying company corruption risks. Companies involved in a corrupt exchange want to hide final beneficial owners: either by registering them in a tax haven (de Willebois, Halter, Harrison, Park, & Sharman, 2011) or through complex ownership structures. Alternatively, they use straw men to avoid public exposure. This often leads to unusual management profiles, e.g. one acting director for multiple companies. While detailed management and ownership data is probably one of the most useful ways to track company risks, it is also the least widely available.

Table 1. Selected company risk indicators
A simple example: company age
The range of potential company corruption proxies is wide, and they can often be linked to government data on transactions such as contracts or mining permits (Fazekas et al., 2016). However, as the ways of using companies for corrupt purposes varies from context to context, we need to tailor the indicators, validate them, and combine them for more precise measurement (triangulation). The simple example below shows how to do this with available data.
The company corruption proxy in this example is the age of a company at the time of exchanging with the state, which is measured as the number of days, months, or years between the company’s incorporation and the commencement date of the exchange between the company and state.
In markets where experience and skills are prerequisites (e.g. mining for minerals, supplying goods), companies incorporated shortly before transaction with the government may have been created only for corrupt purposes, especially when incorporation coincides with government change. In order to derive a corruption ‘red flag’ from the continuous company age indicator, a cut-point needs to mark high-risk values. For the sake of simplicity, we decide that companies younger than one year represent high risk, and all other companies low risk. Note that cut-points may differ by context. Therefore, statistical tests are needed to tailor them to context. We take public procurement in Sweden and Hungary in 2009–2014 as an example.2fab9e201400
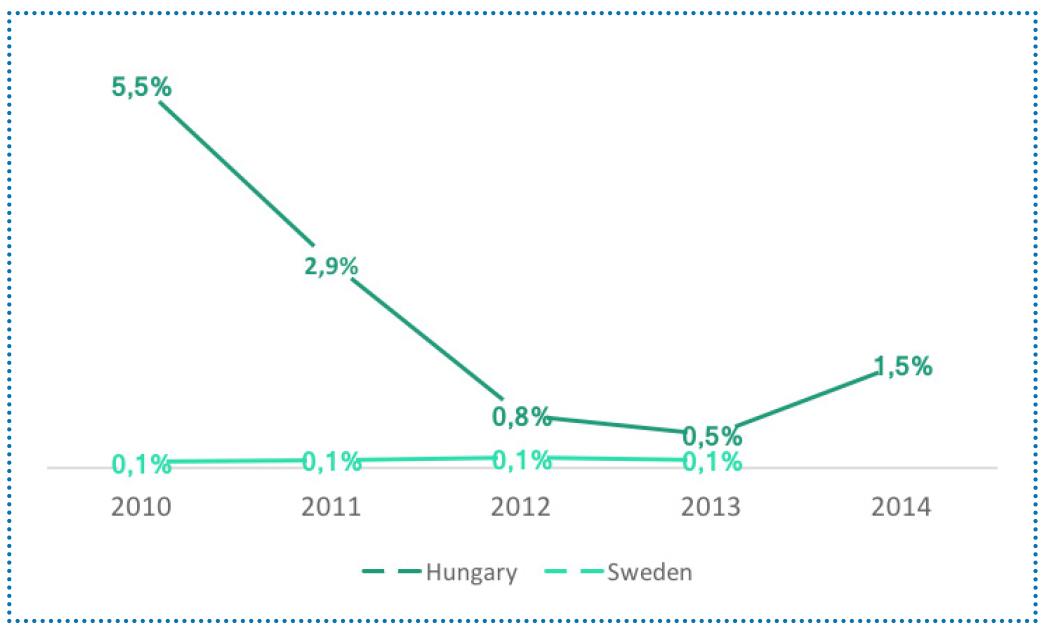
As expected when comparing a perceived high corruption risk country (Hungary) with a perceived low corruption risk country (Sweden), the value of contracts awarded to very young, high-corruption risk companies is considerably higher in Hungary (Figure 1). Note the decline of young companies’ market share in Hungary following the government change in 2010, which probably signals the declining need to rely on new companies for corruption as the overall control of corruption remained largely unchanged (e.g. previously young corrupt companies become older).

Figure 1. Share of public procurement spending going to companies younger than 1 year
Note: Due to a too-high proportion of missing records in 2009 for Hungary and Sweden, and in 2014 in Sweden, we omit these values, even though they confirm the same overall trends.
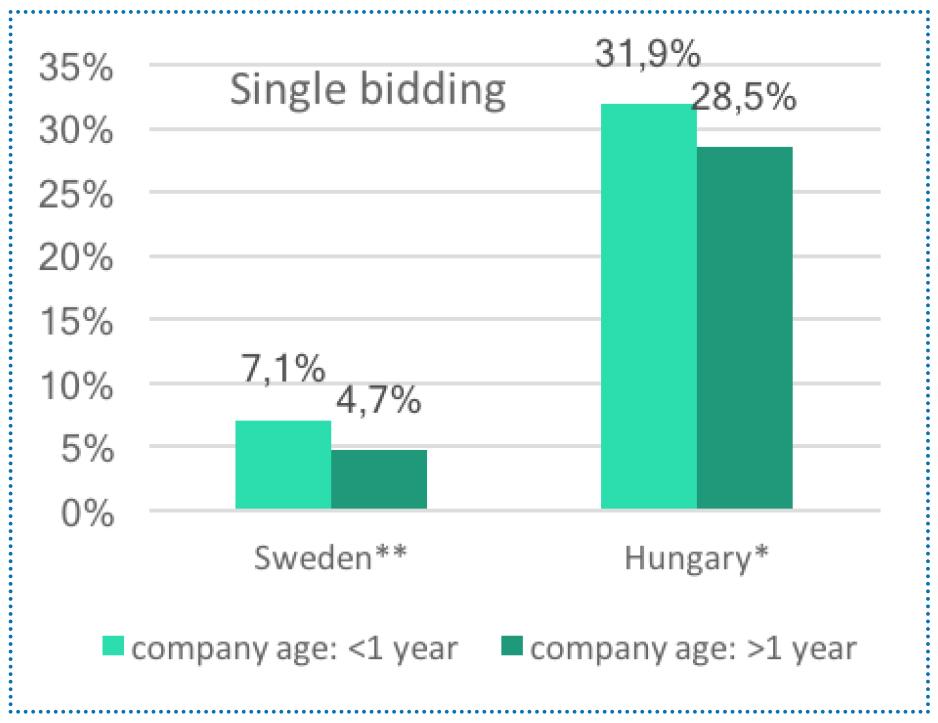
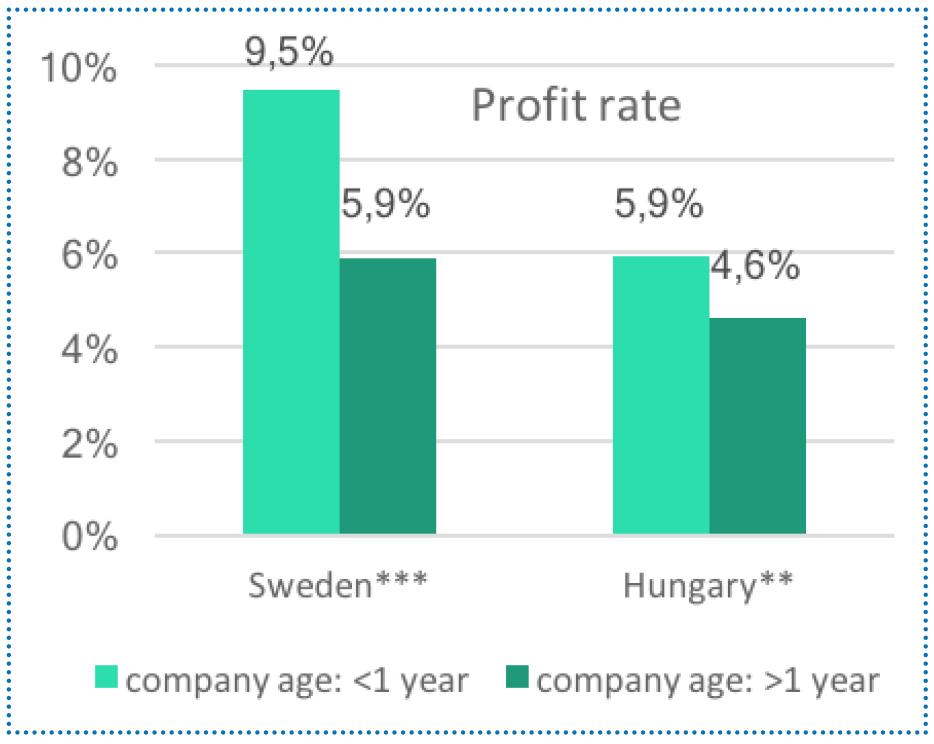
Such a simple indicator needs to be tested and potentially combined with further corruption proxies. If young companies are predominantly used for corrupt exchanges rather than licit economic activities, their transactions should have higher corruption-risks, too. A simple indication that basic rules of open and fair competition were circumvented, is when only one bid is submitted in a supposedly competitive public tender (Fazekas & Tóth, 2016). In both countries, young companies are more likely to be single bidders, by about 2-3 percentage points (Figure 2 – single bidders). If companies are used in corrupt ways, and the resulting proceeds are not hidden offshore, young companies should be found to be more profitable than other companies. In both countries, young companies are 1-3 percentage points more profitable than their longer established peers (Figure 3 – profit rate). Such simple ways of validating and triangulating indicators still requires further analysis – e.g. separating innovative start-ups from corrupt firms because both may be very young and highly profitable (checking company websites or verifying whether a company operates in a high innovation sector could reveal such bias). Looking at companies younger than one year also only allows for tracking a single risk type, missing out corruption that involves long-established firms.

Figure 2. Comparing young companies to their peers: % single bidder contract awards

Figure 3. Comparing young companies to their peers: average profit rate
Note: *** 1%; ** 5%; * 10% significance tests based on random permutation tests
Recommendations for donors
To reap the full benefits of this measurement approach, governments and donors can implement two short-term policies:
- Use already available company data and combine it with transactional data on procurement contracts, mining rights, or grants to track corruption risks at a very high degree of detail and practically in real-time.
- Demand fuller and higher quality disclosure of data on these risk indicators from companies doing business with governments and donors. Such transparency requirements generate minimal additional administrative burden as companies typically compile and report such information annually.
Further reading
The misuse of corporate vehicles, including trust and company service providers
Behind the corporate veil. Using corporate entities for illicit purposes (PDF)
- Data on Hungary is collected and (soon) republished in full by DIGIWHIST: http://digiwhist.eu/resources/data/. Note that contract values and company-level financial data are only available for a sub-set of contracts. Hence, the analysis may suffer from measurement bias.
