This guide is not meant to be exhaustive, and the strengths and limitations identified will often be relative to the intended users’ needs. The tools included in the list were selected based on whether they: i) substantively assess an aspect of corruption/anti-corruption or a related cause of corruption: ii) cover a significant number of countries globally or regionally; and iii) include (and are expected to include in future) a time series. Practitioners interested in a given country are also advised to explore local reports and surveys, which may be more specific and informative.
Considering the above criteria, several methodologies from the 2016 overview have been removed from this edition. The following have been removed as they have been discontinued: the Open Data Index by Open Knowledge Foundation; the Government Defence Anti-Corruption Index by Transparency International; Doing Business by the World Bank; Transparency in Corporate Reporting by Transparency International. The Defence Companies Anti-Corruption Index by Transparency International has not be included as it covers a specific sector rather than a broader concept.
Introduction
The measurement of corruption trends can generate policy relevant empirical data on corruption hotspots and associated risks. It is useful to inform the work of a range of actors, including academics, practitioners, development agencies and the private sector. In recent decades, the number of governance indicators has grown dramatically, with “indices, projects and datasets available number in the dozens, [and] hundreds of distinct indicators underpinning them” (Anheier 2018).
There are substantive challenges to measuring corruption, in part due to the complexity of defining corruption itself. The concept’s complexity means that no single indicator can offer a definitive measurement of corruption (Charron 2021). Most official indicators of corruption only measure one aspect: bribery. This is despite the Sustainable Development Goal Target 16.5 to “substantially reduce corruption and bribery in all their forms” (UN no date). This can be seen in the weak correlation between people’s perceptions of corruption in their country and the proportion of people who have reported paying a bribe, meaning that underlying corruption is not necessarily captured in the measurement of bribery alone (Kenny 2022). Due to the difficulties involved in directly observing corruption as a behaviour that typically takes place behind closed doors, most observed quantitative data captured is best understood as an “imperfect proxy” (Kaufmann, Kraay and Mastruzzi 2010). The multi-faceted complexity of corruption means that both direct and indirect measurements of corruption are valuable (UN 2022). There are continued efforts to create new tools, including the United Nations’ (UN) recent roadmap to develop methodological tools to measure corruption and its causes (UN 2022).
This paper looks at selected publicly available measurement methodologies that assess the level of corruption and adherence to good governance standards, such as transparency and accountability. It also briefly considers the key strengths and limitations of each methodology.
Also included are a selection of measurement methodologies that assess the enabling environment and safeguards believed to constrain corruption. This set of measures is more about the riskof corruption occurring, rather than the incidenceof corruption. As such, these datasets can complement instruments intended to directly measure corruption.
It is worth bearing in mind that while cross-country composite indices provide a useful snapshot of the incidence of corruption in a given polity, their use to practitioners looking to assess the efficacy of specific anti-corruption interventions is limited.
There are therefore some analysts who have called for a move away from aggregated indices towards more specialised measurements, arguing that a “few well-chosen proxy indicators can be more informative than a sea of data or dozens of aggregate, cross-country indices” (Johnson 2013: 2).
Aggregate indexes
Basel Anti Money Laundering (AML) Index, Basel Institute on Governance
https://baselgovernance.org/basel-aml-index
https://index.baselgovernance.org/methodology
Timeframe: 2011 - present
Frequency: yearly
What does it measure? How to use the results?
The Basel AML Index is a ranking and risk assessment methodology that evaluates money laundering (ML) and terrorist financing (TF) threats to a country. It also measures how jurisdictions respond to these risks. It shows progress over time for 128 different jurisdictions and regions that have the available data.
It is the only independent research-based index that ranks the risk of money laundering and terrorist financing and provides a simplified comparison of each country’s risk. The index allows for comparison between jurisdictions over time. The accompanying reports analyse trends – such as the causes of slow progress or regional analyses – that can be used to accompany the simple comparative indexes.
The 18 indicators used in the AML Index are categorised into five domains:
Shortfalls in the Anti-Money Laundering and Combating of Financing of Terrorism (AML/CTF) framework
Corruption and bribery
Poor financial transparency and standards
Poor public transparency and accountability
Weak political rights and rule of law.
Sources
Each of the five domains are constructed from 18 publicly available sources, which include the Financial Action Task Force (FATF) Mutual Evaluation Reports and Follow-up Reports, Tax Justice Network Financial Secrecy Index, Global Organized Crime Index, the CPI, World Bank Extent of Corporate Transparency Index, and International Budget Partnership’s Open Budget Survey, among others.
The index also uses a weighting scheme whereby academics, financial sector professionals and senior AML experts assign a weight to each variable according to its importance. For example, the FATF Mutual Evaluation Report carries a weighting of 35% compared to the Press Freedom Index which is 0.83%. This process entails an annual review meeting where external experts verify the quality of data, the date, country coverage and methodology. All the scores for the country are then combined to give a final ranking between 0 = low risk to 10 = high risk.
Strengths
The index scores countries on the severity of the jurisdiction’s vulnerability to ML/TF alongside their resilience to counteract criminality, allowing for comparison between each one in the dataset (presented in map format or a ranking). The accompanying report divides into seven geographic regions, allowing for risk averages to be shown within each region. The key weaknesses per region are identified (for example, the European Union and Western Europe’s weakest area is the Quality of AML/CFT framework – especially effectiveness of supervision in 2022), as well as the underperforming areas globally, with recommendations (Basel Institute on Governance 2022).
Limitations
The AML Index data collection ends mid-year so does not show developments for the rest of the calendar year. The website recommends that, for compliance or risk assessment purposes, the AML Index Expert Edition be used (as this is updated quarterly rather than annually), but this requires a subscription to access.
Comparability between countries is not always effective as several countries have older FATF Mutual Evaluation Reports than others. Weightings for each data source are also subject to change each year.
Additionally, not all scores are based on the same criteria, so weighting changes per country if the source datasets do not cover the country in question. Given that the AML Index relies on a number of datasets that rely on the same underlying indicators, the same results should not be interpreted as findings from different sources.
Berggruen Governance Index, UCLA Luskin School of Public Affairs and Berggruen Institute
https://www.berggruen.org/2022-governance-index/
Timeframe: 2019 - present
Frequency: every two years
What does it measure? How to use the results?
The Berggruen Governance Index is founded on the premise that the key to good governance is to achieve a good balance between democratic accountability (quality of democracy), state capacity (quality of governance) and public goods provision (quality of life) (Anheier, Lang and Knudsen 2022). This “triangle” theory implies that all three of these dimensions need to be strong and resilient for good governance to exist.
The index examines the interaction between the three pillars in 135 countries between 2000 and 2019, giving each country a score between 0 and 100 based on their score against each primary dimension and three sub-dimensions, which can be compared against other countries. The sub-dimensions of each are:
democratic accountability: institutional accountability; electoral accountability; societal accountability
state capacity: fiscal capacity; coordination capacity; delivery capacity
public goods provision: social public goods; economic public goods; environmental public goods
Sources
Each sub-dimension is measured by three to six indicators. For example, fiscal capacity is measured by tax revenue; trade tax revenue; income tax revenue; total reserves; and interest payments. The data for each of these indicators is taken from the IMF, V-DEM and World Bank.
For a full list of sources for each of theindicators, see Appendix 1.
Strengths
Rather than focusing on a composite performance measure, the index examines the interactions between the three primary dimensions of quality of democracy to assess governance in a country beyond conventional measurements. It also includes the role of civil society and businesses in governance through its dimensions of employment, media, freedom of expression, engagement of society and CSO participatory environment.
Limitations
Data from 2020 onward in the index is unrepresentative of long term trends due to the Covid-19 crisis and its impact on the world’s financial market and other key sources of statistical data.
Corruption Perceptions Index, Transparency International
http://www.transparency.org/research/cpi/overview
Timeframe: 1995 - present
Frequency: yearly
What does it measure? How to use the results?
The Corruption Perceptions Index (CPI) scores and ranks countries based on how corrupt experts and business executives perceive a country’s public sector to be. It is a composite index, a combination of 13 surveys and assessments of corruption collected by various organisations. Its intention is to convey a broad sense of the level of corruption in the public sector compared to the other countries featured.
Since 2012 when the methodology was updated, the CPI uses the raw scores given to each country by different data providers and converts them to fit the CPI scale, from 0 (highly corrupt) to 100 (very clean). Each country is then given a rank reflecting its position relative to the other countries included in the index. As part of the updated methodology, CPI scores after 2012 can be compared from one year to the next.
As the most widely known indicator of corruption worldwide, the CPI is a powerful advocacy tool and sends a strong message to governments around the world. However, because only limited information can be gleaned from a single number, CPI scores and ranks should be used in conjunction with other assessments, including those presented in this guide.
Sources
The CPI is a composite index, aggregating 13 data sources produced by 12 different organisations specialising in governance and business climate analysis. The sources of information used for the CPI are based on data gathered during the previous 24 months. For a country to feature in the CPI, it needs at least three CPI data sources. Due to variances in the availability of underlying data around countries, the number of sources used therefore differs from country to country.
Strengths
Four properties make the CPI a valuable governance index. First, its nearly global coverage.
Second, its greater reliability than each individual data source because it compensates for possible biases or errors among sources by taking the average of at least three different sources.
Third, its 0-100 scale means it can differentiate between perceived levels of corruption with more granularity than sources that, for example, have scales of 1-7 or 1-10 (TI 2019).
Finally, since the underlying CPI sources assess different dimensions and manifestations of public sector corruption, the CPI manages to reconcile different aspects of corruption into one index (TI 2019).
The European Commission Joint Research Centre undertook an independent audit of the CPI 2017 and its methodology. The same audit was conducted in 2012 following the introduction of a new methodology for the CPI calculation. Both audits found that the CPI is conceptually and statistically coherent and has a balanced structure. The full report and recommendations can be found here.
Limitations
The CPI does not measure the actual incidence of corruption; neither does it assess institutional frameworks. The CPI does not distinguish between different types of corruption and focuses exclusively on public sector corruption. It does not capture data on illicit financial flows, money laundering or private sector corruption.
The assessment of people’s perceptions of corruption does not necessarily reflect the actual level of corruption in the country. Additionally, some of the datasets used in the CPI have missing data points. Therefore, estimates are provided for missing data.
Furthermore, because the CPI only measures corruption at the macro level and because perceptions are complex measures and slow to change, it is not advisable to use the CPI to assess the short-term effects of a specific reform.
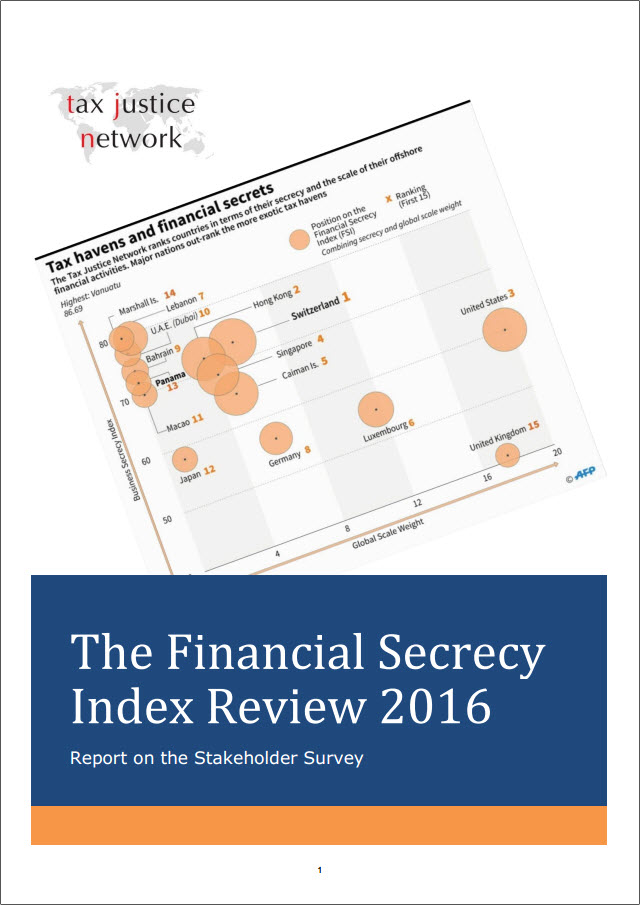
Financial Secrecy Index, Tax Justice Network
Timeframe: 2018 - present
Frequency: every two years
What does it measure? How to use the results?
The Financial Secrecy Index ranks jurisdictions according to the opacity of their financial services industry and the scale of their offshore financial activities. The index is based on 20 indicators grouped around four broad dimensions of secrecy: ownership registration; legal entity transparency; integrity of tax and financial regulation; and international standards and cooperation.
The index is designed to help policymakers, researchers and advocates understand the extent and impact of global financial secrecy, tax havens/secrecy jurisdictions, and illicit financial flows.
The index uses a combination of qualitative and quantitative data to create a measure of each jurisdiction’s contribution to the global problem of financial secrecy. Qualitative data is based on laws, regulations, cooperation with information exchange processes and other verifiable data sources. These are used to prepare a secrecy score for each jurisdiction. Quantitative data is then used to create a global scale weighting for each jurisdiction based on its share of offshore financial services activity in the global total.
Sources
The FSI is constructed on the basis of a database that covers information on the legal, administrative, regulatory and tax structures of each jurisdiction. The main data sources are official and public reports by the OECD, the associated Global Forum, FATF and IMF. In addition, specialist tax databases and websites, such as the IBFD, PwC, Lowtax.net and others are consulted to build the database. Finally, surveys are sent to the ministries of finance and the financial intelligence units of all reviewed jurisdictions. These surveys include targeted questions about the jurisdiction’s tax and regulatory system.
Strengths
The FSI is distinct from most other indexes, which generally focus on identifying corruption and governance problems within countries. The FSI is unique in the sense that it attempts to measure a jurisdiction’s complicity in facilitating criminal and abusive activities carried out elsewhere in a world characterised by footloose finance.
The FSI is based on substantial academic research and expert input. In 2016, 136 experts, users and officials from 49 different countries took part in an open consultation of the FSI methodology. Tax Justice Network is currently seeking feedback on indicators with a focus on practicality, technical appropriateness and consistency by users.
The FSI is actionable in the sense that the report also includes in-depth discussions of all relevant loopholes and sources of information related to financial secrecy in each jurisdiction. This enables researchers, government authorities, activists and financial institutions to obtain relevant information to be used for risk assessment, policy decisions or to advocate for specific transparency measures.
The index itself, or component parts of it, are used in a number of broader governance indexes, such as the Center for Global Development’s Commitment to Development Index and the Basel Anti-Money Laundering Index published by the International Centre for Asset Recovery. In addition, the index is used for risk analysis by a range of private consultancies and at least two central banks (Tax Justice Network no date).
Because the FSI provides a weight to each jurisdiction based on the scale of its trade in international financial services, it gives a more realistic idea of how much influence and responsibility each jurisdiction has on the harm caused by secrecy. The ranking not only reflects information about which are the most secretive jurisdictions but also the extent to which a jurisdiction’s secrecy is likely to have global impact.
Limitations
A number of the concepts used to construct the index are inherently complex which leaves it open to (mis-)interpretation. At the same time, the benchmarks for scoring the countries in the index are not based on internationally recognised standards as these are considered by the Tax Justice Network to be too lenient. Combined with the question of weighting, as discussed above, this has led to claims by some of bias and subjectivity (Becker, Saisana 2018).
The global scale weight has also been criticised for being heavily skewed, in that most jurisdictions have small global scale weights, and very few have large scales. It has been recommended that a log transformation should be used to normalise this distribution (Becker and Saisana 2018).
Fragile States Index, The Fund for Peace
https://fragilestatesindex.org/
Timeframe: 2004 - present
Frequency: yearly
What does it measure? How to use the results?
The Fragile States ranks 178 countries based on the pressures they face that impact their levels of fragility. A lower score for a country’s total indicator means the greater relative stability. The index assesses several indicators measuring a country’s stability, including:
cohesion indicators: a country’s security apparatus, factionalised elites, group grievance
economic indicators: economic decline, uneven development, human flight
political indicators: state legitimacy, public services, human rights
social indicators: demographics, refugees and internally displace people, external intervention
The index’s aim is to help inform projects in the field, by policymakers, field practitioners and local community networks.
Sources
The index is produced by collecting data via three methods: content analysis for each of the 12 indicators (and sub-indicators), quantitative datasets that are analysed from the UN, World Bank and World Health Organization, and a qualitative data review where a team of social science researchers review each country and provide an assessment of key events from that year. These three data streams are triangulated, and biases are checked, and final indicator scores are produced.
Strengths
The dataset ranks each country, with their final indicator, and breaks down each of the four separate indicators and sub-indicators for easy comparison. The entire dataset is also available to download in Excel format from the website.
Limitations
The definition of fragility used by the index is considered by some as too broad, as with the scoring, meaning that too many factors are considered when ranking the countries. Moreover, the underlying indicators used are not made public, so it is unclear as to how the final score is calculated. This means it is not actionable for policymakers.
Global Corruption Index, Global Risk Profile
https://risk-indexes.com/global-corruption-index/
Timeframe: 2018 - present
Frequency: yearly
What does it measure? How to use the results?
The Global Corruption Index measures the state of corruption and white-collar crimes in 196 countries and territories. They are ranked from very low risk (0) to very high risk (100). According to the website, the index can be used to conduct initial risk mappings as part of a company’s compliance.
The index uses four indicators to measure corruption: the ratification of key conventions, level of perceived corruption, reported experience of public and private corruption by citizens and the private sector, and a selection of country characteristics closely linked to corruption. It also measures four indicators under prevention mechanisms: citizens voice and transparency, government functioning and effectiveness, legal context, and political context.
Sources
The index is composed of 42 variables based on datasets from sources such as the UN, the OECD, the World Bank, Transparency International, and others. For the full list see here.
Strengths
The heatmap that is publicly available allows for a global comparison between countries, with their individual scores and ranking.
Limitations
Many concepts are included in the index, such as democracy and legal context, and a wide range of different datasets, which are not necessarily relevant to the measurement of corruption. Furthermore, the full dataset and technical methodology are behind a paywall and are not freely available to the public.
Global Organized Crime Index, Global Initiative Against Transnational Organized Crime
Timeframe: 2021 - present
Frequency: every two years
What does it measure? How to use the results?
The Global Organized Crime Index assesses the level of organised crime and resilience to organised criminal activity within a country. It ranks all UN member states through a dataset modelled on the scope, scale and impact of 10 criminal markets; the structure and influence of four types of criminal actors; and countries’ resilience to organised crime. The index website includes country summaries with background information on each country’s score and key trends.
The scores for organised crime have been compared to the scores for corruption (as measured by the CPI) and a moderate positive correlation has been found in the accompanying report (Global Initiative 2021). Despite the CPI measuring different factors than this index, the positive correlation shows the interconnectedness of corruption and organised crime (Global Initiative 2021).
Sources
The index is produced through an initial literature review, data collection on criminality and resilience, two rounds of scoring, a regional expert group verification and an internal calibration. The criminality indexes assess the type of criminal actors’ prevalence in each country (mafia style groups, criminal networks, foreign actors, etc.) and the type of criminal markets (human trafficking, flora crimes, cocaine trade, etc.). The resilience indicator then assesses the different measures taken by each UN country to prevent organised crime (political leadership and governance, government transparency and accountability, law enforcement, etc.).
Countries can score between 1 and 10. For the criminality index, 1 means there is no to little influence from criminality, and 10 is that there is a severe influence from criminality. For the resilience index: 1 is that there is no or extremely ineffective resilience to organised crime and 10 is for highly effective resilience (Global Initiative 2021).
Strengths
The index is the first methodology to measure the levels of organised crime and resilience to organised criminal activity on a global scale. It allows the user to sort countries comparatively, with global heat maps. The index provides evidence-based research and analysis to help guide policymakers’ responses to organised crime from a socio-economic perspective (Global Initiative 2021).
Limitations
Corruption is not included as an individual criminal market but instead an aggravating factor for determining the score and is presented in the report as one of the major enabling factors of organised crime. The index also relies largely on expert assessments, which measure perceptions rather than empirical data.
Global State of Democracy Indices, International IDEA
https://www.idea.int/data-tools/tools/global-state-democracy-indices
Timeframe: 2017 – present
Frequency: yearly
What does it measure? How to use the results?
The Global State of Democracy Indices measure the democratic performance of 173 countries, with countries categorised into either democracies, hybrid or authoritarian regimes. Its objectives are to assess the global state of democracy through analysing trends and identifying opportunities for improving democracy. It measures the five following attributes associated with democracy:
representative government (free and equal access to political power)
fundamental rights (individual liberties and resources)
checks on government (effective control of executive power)
impartial administration (fair and predictable public administration)
participatory engagement (instruments for and realisation of political involvement) (IDEA 2022)
The most relevant indicator that affects levels of corruption in a country is checks on government. This attribute assesses the strength of horizontal accountability in a country and measures the following sub-attributes: effective parliament (the extent to which legislature oversees the executive), judicial independence (the extent to which courts are not subject to undue influence from branches of the government) and media integrity (the extent to which the media landscape offers critical coverage of political issues) (IDEA 2022).
Sources
Each of the above five attributes are assigned 16 sub-attributes. In total, 116 indicators are used from 12 datasets incorporating four different types of source data: expert surveys, standards-based “in-house coding”, observational data and composite measures.
For the checks on government attribute, the indicators used are V-Dem’s assessment on the effectiveness of parliament and executive oversight and constraints, V-Dem’s assessment on judicial independence, V-Dem’s expert survey responses on whether media is corrupt and Media Freedom House’s in-house coded indicators (IDEA 2022).
For the full list of data sets used see page 22 of the methodology.
Strengths
The indices show the long-term trends and patterns in the global state of democracy. They also point to potential risks of democratic erosion and democratic backsliding.
Limitations
It is not recommended to use the indexes for impact assessments of individual policies as they are too abstract for specifics. Instead, they aim to provide a global overview of trends of democracy. The data relies heavily on the V-Dem data, so any limitations associated with the V-Dem methodology will also apply to these indices.
Ibrahim Index of African Governance, Mo Ibrahim Foundation
Timeframe: 2007 - present
Frequency: yearly
What does it measure? How to use the results?
The Ibrahim Index of African Governance (IIAG) measures the level of good governance in 54 African countries across four categories: security and rule of law; participation, rights and inclusion; foundations for economic opportunity; and human development. The security and rule of law category contains several indicators on accountability, transparency and corruption. The index uses a scale from 0 to 100, where 100 is the best possible score. The index’s dataset is updated every year, implying retrospective revision of the scores from previous years.
Sources
The IIAG is a composite index built on the basis of data collected from 35 independent data sources, including official data, expert assessments and opinion surveys.
To be included, an indicator should cover at least two-thirds of the countries on the continent (35 or more) and should provide at least two years’ worth of data. The latest available data should not be more than three years old, and new data releases should be regular (at least every three years).
Strengths
The index covers most of the countries on the continent, making it a comprehensive tool. The diversity of data sources gives a broad picture of the governance situation on the continent. According to the Mo Ibrahim Foundation, the index and its component parts are useful to support citizens, governments, institutions and the private sector to accurately assess the delivery of public goods and services, and policy outcomes. It is also believed to encourage data-driven narratives on governance issues and help determine debate and strengthen government performance.
Limitations
Some datasets have missing data points. As this can have an effect on a country’s aggregate score, estimates are provided for missing data, following a statistical process called imputation. Given the measurement imprecision, the foundation advises users of the IIAG to avoid the over-interpretation of small score differences.
Index of Public Integrity, ERCAS and Hertie School of Governance
https://corruptionrisk.org/integrity/
Timeframe: 2015 - present
Frequency: every two years
What does it measure? How to use the results?
The Index of Public Integrity (IPI) is a composite index that uses indirect objective measures (proxies) in a conscious attempt to present an actionable corruption measurement methodology.
The IPI provides a measure of a country’s capacity to control corruption and enforce integrity, broadly understood as a balance between constraints (legal + normative) vs resources (power discretion + material resources). The single composite indicator is based on an assessment of six components: budget transparency, administrative transparency, online services, judicial independence, e-citizenship and freedom of the press.
Each final component score is normalised to a range between 1 and 10. The most recent edition from 2021 covered 114 countries in total.
Sources
The index is based on a range of data sources including the UN E-Government Development Index, the Open Budget Survey, the Global Competitiveness Dataset, International Telecommunication Union’s ICT Dataset, Internet World Stats, Press Freedom Report and their own transparency index
For the older editions of the IPI, 2015-2019, the components of administrative burden and trade openness were used in the place of administrative transparency and online services.
Strengths
The IPI has a clear theoretical link to corruption and is conceptually robust, as the index does not aggregate sources or surveys with differing understandings of corruption. In contrast to perception-based measures of governance, the IPI is based on empirically tested factors across different governance contexts.
In addition, the IPI is policy oriented as it is built from six actionable pillars that are closely correlated with corruption, so it can serve as a tool for assessing corruption risks. Each of the six underlying components – administrative burden, budget transparency, trade openness, judicial independence, freedom of the press and e-citizenship – can also be linked to relevant anti-corruption policies that are context specific.
The IPI strongly correlates with the most common corruption measurements, including the CPI and the World Bank’s Control of Corruption index (Mungiu, Dadasov 2016).
Limitations
Although it has been designed to ensure longevity by using data produced as part of a time series, the IPI relies on data being collected by other organisations. This means any significant changes to the underlying indicators could be problematic in future. Indeed, some of the indicators are not produced annually, and a few of the underlying indicators have changed over time.
The IPI’s definition of e-citizenship is based on the percentage of fixed broadband subscriptions, internet users and Facebook users. This is considered by some as an over-simplified understanding of the impact of technology on public integrity and that the real relationship between the two is more nuanced than this.
Public Integrity Indicators, OECD
https://oecd-public-integrity-indicators.org/
Timeframe: 2021 – present
Frequency: varies
What does it measure? How to use the results?
The Public Integrity Indicators measure the integrity systems in OECD countries, and its first dataset has been published for 36 countries. They establish a benchmark for government resilience to corruption risks and provide guidance on how to strengthen public integrity. The indicators are intended to be used by governments to help inform policies.
There are six sets of indicators: quality of strategic framework; accountability of public policy making; meritocracy of the public sector; strength of oversight and control; effectiveness of internal control and risk management mechanisms for safeguarding public integrity; and fairness, timeliness, and openness of enforcement mechanisms. Each country is evaluated on a scale of 0 to 100. Currently, the data is only available for the indicators on quality of strategic framework and accountability of public policy making.
Sources
The indicators were developed by a Task Force from the Working Party of Senior Public Integrity Officials to measure the implementation of the OECD Recommendation on the Council of Public Integrity. The indicators are based on primary data sources and validated by national governments.
Strengths
Each country has a dashboard for the indicator and these focus on actionable criteria and numerical rates, intended to provide reliable evidence on the steps governments should take to curb corruption risks and improve public integrity.
Limitations
More information about the indicators should be made available to the public for the development, monitoring and evaluation of these strategies (Cavaciuti, Johnson, Smidova 2022). So far, the full methodology for the development of the indicators has not been made publicly available.
Rule of Law Index, World Justice Project
https://worldjusticeproject.org/rule-of-law-index/downloads/Index-2022.pdf
Timeframe: 2015 - present
Frequency: yearly
What does it measure? How to use the results?
The World Justice Project’s (WJP) Rule of Law Index is a quantitative tool that measures the rule of law, through consultation with academics, practitioners and community leaders. It ranks eight factors through a general population poll and a qualified respondents’ questionnaire. Each country is assigned a score between 0 and 1, with 1 being the strongest adherence to the rule of law.
The index is comprised of eight pillars: constraints on government powers, absence of corruption, open government, fundamental rights, order and security, regulatory enforcement, civil justice, and criminal justice.
Pillar 2 measures the absence of corruption in governance agencies. It considers three forms of corruption: bribery, improper influence by public or private interests, and misappropriation of public funds or other resources. These three forms are examined with respect to four components:
2.1 government officials in the executive branch do not use public office for private gain
2.2 government officials in the judicial branch do not use public office for private gain
2.3 government officials in the police and the military do not use public office for private gain
2.4 government officials in the legislature do not use public office for private gain
Each of these components is composed of several sub-components, each with underlying indicators.
Sources
The eight pillars are disaggregated into 44 sub-factors. These are assessed through questionnaires sent to the general population and experts (World Justice Project 2022). The World Justice Project team identifies, on average, more than 300 potential local experts per country to respond to the expert questionnaires for each issue of the index and engages the services of leading local polling companies to implement the household surveys.
The general population poll collects first-hand information on the perceptions and experiences of ordinary people regarding the rule of law, including their interactions with government, the ease of this and state bureaucracy, the extent of corruption, the availability of dispute resolution systems and the prevalence of common crimes (World Justice Project 2022). The qualified respondent’s survey asks in-country practitioners and academics about topics such as the efficacy of courts, the strength of regulatory enforcement and reliability of accountability mechanisms (World Justice Project 2022). The survey results are then aggregated to produce scores and tested to identify any errors or biases.
Strengths
The Rule of Law Index is the first to systematically quantify the rule of law globally.
Limitations
While the index shows the dimensions of the rule of law that may be weak (or strong) in each country, it does not establish causation. Therefore, the authors of the index emphasise that it is necessary to use this index alongside other analytical tools to find possible solutions. Rapid changes in the rule of law in some countries may be sensitive to the specific point when this data was collected and, in some countries, there were fewer experts to provide the qualified respondent’s survey.
Additionally, the World Justice Project publishes the scores for each component, but not for sub-components or the specific underlying indicators.
The Economist Intelligence (EIU) Democracy Index
https://www.eiu.com/topic/democracy-index/
Timeframe: 2006 - present
Frequency: yearly
What does it measure? How to use the results?
The Economist Intelligence Democracy Index provides a snapshot of the state of democracy in 156 countries and territories. It contains five categories: electoral process and pluralism, functioning of government, political participation, political culture and civil liberties.
Based on each country’s score, it is then classified as either: full democracy, flawed democracy, hybrid regime or authoritarian regime. Each country is rated on a scale of 0 to 10, with full democracies having a score greater than 8 and authoritarian regimes a score less than or equal to 4.
Sources
The scoring is based on the ratings for 60 indicators, which are then grouped into the five categories. These are completed through expert surveys and public opinion surveys. The public opinion surveys are predominately from the World Values Survey. Additionally, other sources include the Eurobarometer surveys, Gallup surveys, Asian Barometer, Latin American Barometer, Afrobarometer and national surveys.
Strengths
The monitor allows for comparison between countries over time, between 2006 to 2021, and provides a regional overview with setbacks and progress identified. It covers a broad understanding of democracy, beyond an electoral democracy. It also measures a wider range of factors such as media freedom and judiciary independence.
Limitations
The methodology provided does not go into detail with which data source is used for each category, and how the final score is weighted against each question is also unclear.
TRACE Bribery Risk Matrix, TRACE International
https://www.traceinternational.org/trace-matrix
Timeframe: 2014 - present
Frequency: yearly
What does it measure? How to use the results?
The TRACE Bribery Risk Matrix measures the business bribery risk in 194 countries and territories. Each country risk score is determined by four domains: business interactions with government, anti-bribery deterrence and enforcement, government and civil service transparency, and capacity for civil society oversight. These are displayed on a global map, where countries are ranked between very low bribery risk, to very high bribery risk alongside their respective scores in each domain.
Sources
Each domain is composed from public datasets, each variable is scaled to a normal distribution and a score is then calculated from the average of these. The datasets include E-Government Development Index, V-Dem, Enterprise Surveys, Rule of Law Index, among others. For the full list for each domain see pages 4 to 7 of their methodology.
Strengths
The risk matrix addresses the concerns for companies who do business internationally by providing an estimate of how likely they will be asked for a bribe by a public official.
The website shows the results by each of the four domains, and to show the trends over time for each country by sub-domain. The risk matrix draws on the datasets to provide a overall risk score that helps companies examine bribery risk, as well as insights into societal attitudes towards bribery and the government’s ability to enforce anti-bribery laws (Beslija 2021).
Limitations
Their methodology notes that a loss of certain data sources has affected the most recent risk matrix. This includes the Ease of Doing Business Index by the World Bank and the Global Competitiveness Report by the World Economic Forum. New data points have been added to replace these, but these changes have impacted the most recent edition’s scores and rankings. This also means that year-on-year comparisons are ineffective.
Varieties of Democracy (V-Dem), V-Dem Institute
https://www.v-dem.net/about/v-dem-project/methodology/
Timeframe: 2009 - present
Frequency: yearly
What does it measure? How to use the results?
The V-Dem indices measure democracy, distinguishing between five different principles of democracy: electoral, liberal, participatory, deliberative and egalitarian in 202 countries. Its disaggregated dataset reflects the complexity of democracy as a system that goes beyond the simple presence of elections.
There are several V-Dem indexes that pertain to corruption directly:
3.4.1.2 executive bribery and corrupt exchanges (C variable)
3.4.1.3 executive embezzlement and theft (C variable)
3.4.1.4 public sector corrupt exchanges (C variable)
3.5.1.6 legislature corrupt activities (C variable)
3.7.0.6 judicial corruption decision (C variable)
3.11.0.10 media corrupt (C variable)
5.7.1 political corruption index (D variable)
5.7.2 executive corruption index (D variable)
5.7.3 public sector corruption index (D variable)
Sources
V-Dem uses a pool of more than 3,700 country experts, with five selected per country and data collected via online surveys. The expert data is coded with a measurement model to account for uncertainty about estimates and potential biases. They are typically academics or professionals with specialist knowledge in one or more domains, and the majority are nationals or residents of the country they provide information on. They are selected through their expertise, local knowledge, seriousness of purpose, impartiality and diversity.
As an example, the index “3.4.1.2 executive bribery and corruption exchanges” is measured through asking interviewees “How routinely do members of the executive (the head of state, the head of government, and cabinet ministers), or their agents, grant favours in exchange for bribes, kickbacks, or other material inducements?”(V-Dem Institute 2021). When the results are collected, the V-Dem model algorithmically estimates the degree to which an expert is reliable relative to other experts, providing users with the best estimate of the final value.
Each V-Dem variable is divided into different types depending on the method of data collection, through A-C. The two variables mentioned in the section above, C and D are measured through:
Type C: variables coded by country experts. A scholar or professional with knowledge of the country or political institution, and multiple experts are used per variable
Type D: indices. Variables composed of Type A, B or C variables through adding a denominator by creating a cumulative scale or by aggregating larger concepts.
Strengths
The data explores the different categories of democracy and the causal mechanisms that link different aspects of democracy together. It also allows for comparison between indicators and different countries with multiple options on the website for presenting data.
Methods of data visualisation on the website include a mapping tool to show the distribution of scores for an indicator around the world, a country graph to compare multiple variables/indexes for one country, and a regional comparison graph between two selected years, among others.
The methodology is continually adjusted and updated to incorporate improvements.
Limitations
The data is re-published every year and data is changed retroactively, meaning that the trends might be different from those in previous years. Any analysis using V-Dem data would need to be repeated based on the latest publication.
Additionally, the country data is provided by local experts who do not provide narrative justifications to their scoring, meaning that unexpected changes in the scores are not explained. Moreover, five experts per country per year is a small selection to provide the data for each indicator.
Worldwide Governance Indicators, World Bank
http://info.worldbank.org/governance/wgi/index.aspx#home
Timeframe: 1996 - present
Frequency: yearly
What does it measure? How to use the results?
The Worldwide Governance Indicators (WGI) provide an assessment of the quality of six broad dimensions of governance: voice and accountability; political stability and absence of violence; government effectiveness; regulatory quality; rule of law; and control of corruption. The indicators are reported in two ways: (1) in their score, ranging from -2.5 to 2.5, and (2) in percentile rank terms from 0 to 100, with higher values corresponding to better outcomes.
The WGI present aggregate and individual governance indicators for 215 economies over the period 1996–2021 and can be used to observe trends over longer periods of time. The WGI also serve for country comparisons and provides standard errors accompanying the scores, which reflect the number of sources available for a country and the extent to which these sources agree with each other. These margins of error should be taken into account when making comparisons across countries and over time.
The indicator on control of corruption measures perceptions of the extent to which public power is exercised for private gain (petty and grand forms of corruption) and state capture. On voice and accountability, the indicator captures perceptions on the extent to which citizens can participate in selecting their government, freedom of expression, freedom of association and a free media, and can be particularly useful when assessing vertical accountability.
The six composite WGI measures are useful for broad country comparisons from a global perspective and for evaluating trends over time. However, they are often too blunt to be useful in informing the development of specific governance reforms in particular country contexts. They should also be used in conjunction with other more detailed measures of governance at the national level.
Sources
The WGI are composite governance indicators based on 30 underlying data sources (from survey institutes, think-tanks, non-governmental organisations, international organisations and private sector firms). These data sources are rescaled and combined to create six aggregate indicators using a statistical methodology known as the unobserved components model. The results include margins of error, corresponding to 90% confidence intervals.
Strengths
The WGI provide a comprehensive assessment from various data sources on the largest range of countries, including household and company surveys. It includes factsheets on each of its six variables with the sources included in them; see, for example, the control of corruption factsheet here.
Limitations
The control of corruption dimension is based on experience and perceptions data such as the Afrobarometer and Latinbarometer. A further limitation, as discussed above, is the lack of context specificity of the WGI and thus their limited usefulness in informing the formulation of local reforms.
Expert country assessments
Africa Integrity Indicators, Global Integrity
http://aii.globalintegrity.org/
Timeframe: 2012 - present
Frequency: yearly
What does it measure? How to use the results?
The Africa Integrity Indicators (AII) assesses social, economic, political and anti-corruption mechanisms at the national level across 54 African countries.
It comprises 54 in-practice indicators, divided into two categories: transparency and accountability, and social development. The transparency and accountability section consists of 30 indicators examining issues including the rule of law, accountability, elections, public management integrity, civil service integrity and access to information. Global Integrity takes into account both de jure provisions and de facto realities of implementation in each country. The social development section consists of 24 indicators on gender, rights, welfare, rural sector, business environment, health and education.
Sources
The AII are scored by in-country researchers following an evidence-based investigation methodology. Each indicator consists of three elements, a score, an explanatory comment and sources. Data is gathered through legal and scholarly reviews, interviews and reviews of media stories. Certain indicators have recently been removed, including the “in-law” indicators that indicated little change year to year. The focus is now primarily on the “in-practice” indicators that measure implementation. The scoring criteria for these indicators are provided for 100, 50 and 0. The researchers also have the option to score 75 or 25, whenever the higher or lower defined criteria do not accurately represent the research findings. The resultant data points are then subject to blind peer review by a panel that draws on the expertise of a mix of in-country and external experts.
Strengths
Rather than relying on experiences or pre-existing perceptions by experts, the methodology requires a variety of sources of information to be reviewed and documented (including legal and scholarly reviews, interviews with experts and reviews of media stories) to substantiate the score choice. Each indicator is presented with three elements: score, explanatory comment and sources. These components mean that a given scorecard presents a wealth of information. Scores allow for general comparisons across countries, while sources and comments provide a unique window into the realities of regulation and enforcement in each country.
Limitations
It is important to note that the social development section of the questionnaire was designed to feed into the Ibrahim Index of African Governance (IIAG) in areas not covered by the secondary data sources it uses. Therefore, it does not try to be a comprehensive assessment by itself.
CIVICUS Monitor, CIVICUS
Timeframe: 2016 - present
Frequency: updated continually
What does it measure? How to use the results?
The CIVICUS Monitor provides an assessment of the conditions for civil society, as defined as the respect in policy and practice for freedoms of association, peaceful assembly and expression. It compiles these into civic ratings for 196 countries, categorising their civic space as either: open, narrowed, obstructed, repressed or closed.
Sources
Qualitative and quantitative data are used for a country’s rating. The data sources used are reports produced by civil society, international indexes on civic space, country-specific reports produced by CIVICUS, periodic reports by CIVICUS Monitor research partners and input by the users of the website. An independent panel of experts then reviews the final score from these sources and may recommend an alternative rating to the one calculated.
The three international assessments of civic space used are: Freedom in the World Index, V-Dem, and the peaceful assembly indicator of the World Press Freedom Index. The CIVICUS Monitor research partners include Asia Democracy Network, Arab NGO Network for Development, European Civic Forum, West Africa Civil Society Institute, among others.
Strengths
The data provided by the CIVICUS Monitor is up to date, and their world map provides access to live updates and threats tracked by civil society around the world. The information is triangulated by local groups and reflects the rapidly changing environments in which they operate.
Limitations
The methodology highlights that, although some countries may have the same category of civic space rating, the experiences of civil society can still be widely different within these. Each country context is unique, and while it is useful to have a scale to compare countries, it is also important to note their specific contexts.
Country Policy and Institutional Assessment, World Bank
https://databank.worldbank.org/source/country-policy-and-institutional-assessment
Timeframe: 1980 - present
Frequency: yearly
What does it measure? How to use the results?
The Country Policy and Institutional Assessment (CPIA) is intended to capture the quality of a country’s policies and institutional arrangements. The CPIA measures the extent to which a country’s policy and institutional framework supports sustainable growth and poverty reduction, and consequently the effective use of development assistance.
The CPIA consists of 16 criteria – among which are transparency, accountability and corruption in the public sector – grouped into four equally weighted clusters: economic management, structural policies, policies for social inclusion and equity, and public sector management and institutions. For each of the 16 criteria, countries are rated on a scale of 1 (low) to 6 (high). The scores depend on the level of performance in a given year assessed against the criteria, rather than on changes in performance compared to the previous year.
Sources
Data is collected through surveys of World Bank country experts, using quantitative and qualitative country data to guide ratings. The process of preparing the ratings involves two phases: (1) the benchmarking phase, in which a small, representative, sample of countries is rated in an intensive bank-wide process; and (2) a second phase, in which the remaining countries are rated using the derived benchmark ratings as guideposts.
Strengths
The CPIA gives an in-depth account of how well budgets are linked with policies and a general overview of a country’s policy/institutional framework.
Limitations
Due to the sensitive nature of the data, detailed explanations of the rating process are not available to the public. The scores are not comparable over time. The CPIA has also received criticism for regional differences in the quality of the written justifications accompanying the ratings (Knack 2016). It only covers a limited number of countries, and some regions are under-represented in the assessment.
EuroPAM, ERCAS
http://europam.eu/?module=about
Timeframe: 2012 - present
Frequency: every one to three years
What does it measure? How to use the results?
EuroPAM is an extension of the Public Accountability Mechanisms Initiative (PAM) by the World Bank. It is a database based on PAM indicators for financial disclosure, conflict of interest restrictions and freedom of information for 34 European countries. It also adds a database on public procurement and updates the IDEA database on political financing.
It scores each country on the five indicators: political financing, financial disclosure, conflict of interest, freedom of information and public procurement. An overall score for each country is produced from 0 to 100.
Sources
Researchers provide summaries of the legal provisions from primary source documents, and this is sent to in-country experts who have in-depth knowledge of the legal context of the country for feedback. The final data and scores are released in both quantitative and qualitative forms.
Strengths
The scores are disaggregated year on year and for each indicator, both quantitative and a narrative contextual analysis for each country are provided. The full list of sub-indicators for each of the five main indicators and how they are scored are available for download from the website.
Limitations
The index relies heavily on expert assessments, which can be subjective. Additionally, the database primarily measures legislation rather than the strength of implementation.
Exporting Corruption Report, Transparency International
https://www.transparency.org/en/publications/exporting-corruption-2022
Timeframe: 2018 - present
Frequency: two to three years
What does it measure? How to use the results?
Transparency International’s Exporting Corruption report assesses the enforcement efforts of 47 leading export countries in their implementation of the OECD Anti-Bribery Convention. The most recent 2022 report assesses the period between 2018 and 2021. It ranks countries on a scale of active enforcement, moderate enforcement, limited enforcement, and little or no enforcement. It also presents the changes in enforcement levels, either improvement or decline.
Sources
Each country is scored with different weightings for across the pillars of commencing investigations, commencing cases, commencing major cases, concluding cases with sanctions, and for concluding major cases with substantial sanctions. Experts such as anti-corruption agency staff or lawyers provide the data for the status of cases. The enforcement ratings are then multiplied by their percentage share of world exports. Corporate or criminal lawyers who are experts in foreign bribery assist the final preparation of the report.
Strengths
This assessment covers all investigations, settlements or other dispositions of cases. The assessment adopts a broad definition of foreign bribery cases, covering cases where foreign bribery is the underlying issue, whether brought under laws dealing with corruption, money laundering, tax evasion, fraud or violations of accounting or disclosure requirements (Dell 2020).
Limitations
The methodology assumes that foreign bribery is in proportion to export activities and that comparisons between these countries can be made. However, Transparency International recognises that other factors (such as foreign investment or culture of business ethics) can also affect the potential for foreign bribery. These variables are not currently included in the weighting.
FATF Mutual Evaluations, The Financial Action Task Force
https://www.fatf-gafi.org/publications/mutualevaluations
Timeframe: 2004 – present
Frequency: approximately every eight to ten years
What does it measure? How to use the results?
The FATF Mutual Evaluations are peer reviews on an ongoing basis of each FATF member to assess its compliance with and implementation of the FATF Recommendations. The FATF Recommendations are global standards against money laundering and terrorist financing, and include recommendations such as criminalising money laundering, application of targeted financial sanctions related to terrorism and terrorist financing, the monitoring of financial secrecy laws, among numerous others. For the full list, see here.
The mutual evaluations analyse each FATF country’s capacity to prevent criminal abuse of the financial system. The reviewed country is then assigned a level of compliance to the recommendations as either compliant, largely compliant, partially complaint or non-compliant. A mutual evaluation report provides an in-depth description and analysis of a country’s system for preventing criminal abuse of the financial system as well as focused recommendations for the country to further strengthen its system.
Sources
FATF assesses each country through an evaluation and monitoring process that comprises of two assessments. The technical compliance assessment looks at the specific requirements of the FATF Recommendations and whether they are present in the legal and institutional framework of the country. The effectiveness assessment looks at the adequacy of implementation and the extent to which a country achieves a defined set of outcomes for a robust anti-money laundering and curbing the financing of terrorism system. These are assessed by groups of experts via in-country visits.
Strengths
The new focus in the fourth evaluation round on effectiveness rather than technical compliance is encouraging. Experts convened by the Basel Institute on Governance (2017) observed that the new assessment methodology is a significant improvement, and fourth round mutual evaluation reports “fully correspond to the structural characteristics of the [assessed] countries”.
The FATF evaluation process also includes follow-up procedures to assess whether the recommendations made in the mutual evaluation report have been implemented. For three years after the adoption of the mutual evaluation report, each assessed country is expected to report on its progress and, after five years, the FATF conducts a follow-up assessment of the reforms the country has introduced to improve the effectiveness of the AML framework.
Limitations
A recent academic study of the FATF evaluation process concluded that “there have been few efforts by country evaluators in the FATF Mutual Evaluation Reports (MERs) to acquire qualitative data or seriously analyse either quantitative or qualitative data” (Levi, Reuter and Halliday 2017).
This is acknowledged in the FATF (2013) guidance document for conducting national risk assessments, which observes that:
“while quantitative assessments (i.e. based mostly on statistics) may seem much more reliable and able to be [sic] replicated over time, the lack of available quantitative data in the ML/TF field makes it difficult to rely exclusively on such information. Moreover, information on all relevant factors may not be expressed or explained in numerical or quantitative form and there is a danger that risk assessment relying heavily on available quantitative information may be biased towards risks that are easier to measure and discount than those for which quantitative information is not readily available”.
In the absence of systematic data analysis, therefore, it is difficult to compare the effectiveness of different countries’ AML frameworks.
Although mutual evaluation reports in the fourth round have made a greater effort to systematically collect and analyse data, Levi, Reuter and Halliday (2017) note that FATF has still not established procedures that provide sufficient informative evaluations.
Additionally, there are long gaps of around eight years between different rounds. The evaluation process is not transparent in their publicly available methodology.
Freedom in the World, Freedom House
https://freedomhouse.org/report/freedom-world
Timeframe: 1972 - present
Frequency: yearly
What does it measure? How to use the results?
The Freedom in the World scores rates citizen access to political rights and civil liberties in 210 countries and territories, ranking them on a scale of not free, partly free and free. It also provides a trend analysis. It shows the countries that have had statistically significant changes year on year – between + 3 (more free) and – 3 (less free). The methodology can be used to analyse levels of democratic accountability in a country by policymakers, journalists, academics and activists.
Sources
The Freedom in the World uses a two-tiered scoring system of scores and status, with countries awarded points for political rights and civil liberties indicators. The set of questions for each indicator is presented as a scoring checklist to a team of in-house and external analysts and expert advisers from the academic, thinktank, and human rights communities. It then assigns each assessed country as free, partly free or not free depending on their final score (Freedom House 2022).
Strengths
The Freedom in the World scoring contains 25 different political rights and civil liberties indicators. These are all useful when understanding drivers of and constraints of corruption. For example, the answers provided to “E2. Is there freedom for nongovernmental organisations, particularly those that are engaged in human rights and governance-related work?” and “F1. Is there an independent judiciary?” (Freedom House 2022) can help to explain some of the causes of corruption in a country and ascertain whether safeguards are lacking.
Limitations
Freedom House’s measurement of democracy is based on predominately political rights and civil liberties, rather than a wider interpretation of democracy.
Global Right to Information Rating (RTI), Access Info, Centre for Law and Democracy
Timeframe: 2011 - present
Frequency: updated continually
What does it measure? How to use the results?
The RTI rating measures the quality of the world’s access to information laws. It comparatively assesses the strength of legal frameworks for the right to information, using 61 indicators that each correspond to a particular feature of a good RTI regime. The indicators are divided into seven categories: right of access; scope; requesting procedures; exceptions and refusals; appeals; sanctions and protections; and promotional measures. Each country is scored out of 150 points.
Sources
The scoring is carried out by researchers at the Centre for Law and Democracy and Access Info. An advisory council of experts on the right to information provides advice on the development of the indicators and scoring system. Local experts are also used to review the scores and provide feedback.
Strengths
The RTI rating offers a comprehensive assessment of the legal framework of every country’s right to information legislation, and it is updated continually to reflect real-time changes. It also disaggregates its data behind the score for each indicator.
Limitations
The RTI rating only measures the legal framework not the quality of the implementation. There might not necessarily be a positive correlation between strength of law and positive implementation.
Open Budget Survey and Index, International Budget Partnership
https://internationalbudget.org/open-budget-survey
Timeframe: 2006 - present
Frequency: every two years
What does it measure? How to use the results?
The Open Budget Survey assesses the public availability of budget information and other budgeting practices that contribute to an accountable and responsive public finance system (International Budget Partnership).
The majority of the survey questions assess what occurs in practice. The survey assesses the contents and timely release of eight key budget documents that all countries should issue at different points in the budget process, according to generally accepted good practice criteria for public financial management. The Open Budget Survey covers additional topics of relevance to public participation and trust including the extent to which the public can participate during each phase of the budget process, factors related to legislative strength and the capacity and independence of formal oversight institutions (International Budget Partnership).
The Open Budget Survey is also used to create the Open Budget Index (OBI). Each country is given a score between 0 and 100 that determines its ranking on the Open Budget Index.
Sources
The results of the Open Budget Survey are based on a comprehensive questionnaire completed by a local researcher or group of researchers. Almost all of the researchers responsible for completing the Open Budget Survey belong to either academic institutions or civil society organisations. All responses to the survey questions must be supported by evidence such as citations from budget documents; the country’s laws; or interviews with government officials, legislators or experts on the country’s budget process. The answers are also cross-checked against published budget documents and reports on fiscal transparency issued by international institutions (IMF, World Bank, OECD) and peer reviewed.
Strengths
The OBI is the world’s only comparative measure of central government budget transparency. It assesses a wide range of indicators on the depth and quality of a budget process.
Limitations
Country coverage has been expanded and, as a result, appropriate time comparisons would need to make use of a constant country set, particularly if the aggregation of indicators is performed for regional comparisons or indexes. The survey only evaluates national budget processes, not at local government or other public institution levels. Its primary focus is on budget transparency, and other factors that contribute to a good budget process (such as public participation or oversight) are only secondary considerations.
Furthermore, the methodology and questionnaire underwent some revisions since the 2012 survey round, which, among other things, has affected the number and numbering of the questions.
Open Data Inventory, Open Data Watch
https://odin.opendatawatch.com/
Timeframe: 2015 - present
Frequency: yearly
What does it measure? How to use the results?
The Open Data Inventory evaluates the openness of data provided on websites maintained by national statistical offices (NSOs) and any government website accessible from this. Countries are scored by how complete and open an NSO’s data offerings are. In its most recent edition, it assessed 187 countries, ranking them out of 100 for overall coverage and openness of their data.
It aims to identify gaps and promote open data policies. This is important when assessing government accountability and transparency. It reviews published statistics in over 20 categories, grouped under social, economic, financial and environmental statistics. For example, data on government finance is collected with indicators on revenue and expenditure and how open the data on NSO websites are.
It assesses the openness of data through the Open Data Charter, that “open data should be machine readable in non-proprietary formats, accompanied by descriptive metadata and export options that allow customization and bulk download, and should be free to be used and reused for any purpose without limitations other than acknowledgement of the original source” (Open Data Watch).
Sources
The assessment is completed by 8-10 experts with a background in development data, who search each NSO website for data on the 65 indicators. The findings then go through several review stages.
Strengths
The dataset can be used to promote open data policies to improve data access and transparency. Country reports are provided with the scores for each indicator disaggregated.
Limitations
The dataset offers little analysis beyond the empirical data, and 8-10 experts is a small pool to cover 187 countries and could lead to a margin of error. The relevant national legal frameworks for each country are provided in the country reports, but there is no analysis to accompany these as to whether the findings show implementation of the legislation or not.
Press Freedom Index, Reporters without Borders
https://rsf.org/en/index-methodologie-2022
Timeframe: 2002 - present
Frequency: yearly
What does it measure? How to use the results?
The World Press Freedom Index compares the level of press freedom in 180 countries and territories. Press freedom is defined as “the ability of journalists as individuals and collectives to select, produce, and disseminate news in the public interest independent of political, economic, legal, and social interference and in the absence of threats to their physical and mental safety”. The scores range between 0 and 100, with 100 being the highest level of press freedom and 0 being the lowest.
Sources
The index is calculated through a quantitative tally of abuses against journalists in connection to their work and against media outlets, and a qualitative analysis of the situation based on the responses of experts in response to a questionnaire. Each score is evaluated using five contextual indicators: political context, legal framework economic context, sociocultural context and safety.
Strengths
The data is updated if any major changes happen between the end of the year assessed and publication, ensuring that the index is always up to date. For example, the 2022 index was updated to reflect changes in Russia, Ukraine and Mali.
Limitations
It has been criticised that while “control of the media” is measured- the level of independence of the media – analysis on the ownership structure is not included (Frutos, Giannone 2018). It also does not analyse the restrictions to freedom of information imposed by the free market (Frutos, Giannone 2018). Some criticisms therefore state that the index reduces freedom of press to the free market, ignoring other fundamental rights provided by the state (Frutos, Giannone 2018).
Sustainable Governance Indicators, Bertelsmann Foundation
https://www.sgi-network.org/2022/
Timeframe: 2009 - present
Frequency: every two to three years
What does it measure? How to use the results?
The Sustainable Governance Indicators (SGI) explores how governments in 41 EU and OECD countries adhere to the principles of sustainable development across three pillars: sustainable policies, robust democracy and good governance. These three pillars are broken down into six dimensions (economic policies, social policies, environmental policies, quality of democracy, executive capacity and executive accountability), which are further broken down into 32 sub-dimensions, one of which is “corruption prevention”.
The SGI is designed with policymakers and practitioners throughout the OECD and EU in mind, to support their work in effective governance.
Sources
The SGI relies on a combination of qualitative assessments by country experts and quantitative data drawn from official sources of administrative data. To aggregate 152 indicators into composite indexes, the quantitative indicators (which use varying scales and units of measurement) are standardised, with scores ranging from 1 (worst) to 10 (best).
Strengths
The SGI is subject to a thorough peer review and quality assurance process. The assessments of the SGI’s Expert Network undergo a six-stage peer review to ensure the validity and reliability of expert assessments. Final scores are audited and approved by an advisory board composed of academics and practitioners.
Limitations
Because some indicators have been replaced by others over time and additional countries have been added to the sample, comparability over time is not straightforward.
Transformation Index, Bertelsmann Foundation
https://bti-project.org/en/?&cb=00000
Timeframe: 2006 - present
Frequency: every two years
What does it measure? How to use the results?
The Bertelsmann Transformation Index (BTI) examines whether and how low and middle-income countries manage social change towards democracy and a market economy. Within this framework, the BTI publishes two rankings: the Status Index and the Management Index. The Status Index assesses the state of political and economic transformation for 137 “developing and transformation countries”. The Management Index assesses the quality of governance, which rates the proficiency with which decision makers steer political processes.
Scores take into account existing legal measures on the books and de facto realities of practical implementation in each country. Corruption related indicators include: “To what extent are public officeholders who abuse their positions prosecuted or penalized?” and “To what extent does the government successfully contain corruption?”
According to the Bertelsmann Foundation, rankings are designed to highlight differences between individual countries and to make factors key to progress more readily identifiable. However, the focus on rankings and the isolated consideration of one or only a few questions cannot replace a more thoroughly articulated analysis of a country’s strengths and weaknesses.
Sources
Guided by a standardised codebook developed by the Bertelsmann Foundation, country experts for each of the 137 countries included in the index assess the extent to which a total of 17 criteria have been met and assign scores accordingly. A second country expert then reviews these assessments and scores. In a final step, consistency is assured by subjecting each of the 49 individual scores to regional and inter-regional calibration processes.
Strengths
The BTI provides detailed country reports with a mix of quantitative and qualitative data to contextualise the scores. The disaggregated data and qualitative assessments help to understand specific weaknesses and loopholes in legal and institutional frameworks.
Limitations
While questions in the codebook are designed to eliminate cultural or regional bias to ensure their applicability to a broad diversity of states, because the BTI refers to nation-state frameworks, transnational developments and disparities at the sub-national level are addressed only to a limited extent in the country reports.
Transparency Index, ERCAS and Hertie School of Governance
https://corruptionrisk.org/transparency/
Timeframe: 2021 - present
Frequency: unclear
What does it measure? How to use the results?
The index assesses transparency in 128 countries and defines transparency as “the available and accessible (cost free) minimal public information required to deter corruption and enable public accountability in a society” (ERCAS). The index contains two sets of indicators, one for de jure transparency and one on de facto transparency.
Each country’s score represents the percentage to which the target of “anti-corruption transparency” has been fulfilled. It disaggregated components to be used as a diagnostic tool for international donors, and practitioners and activists in the field of government transparency.
Sources
For the de jure index, the implementation of anti-corruption international agreements and treaties are assessed, including: UNCAC ratification, membership to Open Government Partnership, Freedom of Information in national legislation, among others. It uses publicly available websites to collect this information. For the de facto components a questionnaire is used and sent to experts.
Strengths
The index is a comprehensive and comparative measurement of transparency which can be used for public policy and good governance. It establishes benchmarks of transparency and is based on empirical data. The index also offers specific policy targets.
Limitations
The index only measures internet-based transparency and does not assess the quality of information provided by governments.
Public opinion surveys
European Quality of Government Index, Quality of Government Institute
https://www.gu.se/en/quality-government/qog-data/data-downloads/european-quality-of-government-index
Timeframe: 2010 - present
Frequency: unclear
What does it measure? How to use the results?
European Quality of Government Index measures perceptions of and experiences with public sector corruption within the European Union. It covers all 27 EU member states, including the UK before Brexit and two accession countries.
The survey focuses primarily on public services, such as education, health and law enforcement, which are often administered by sub-national authorities. Questions focus not only on perceptions but also on citizens’ experience of services and their level of satisfaction, as well as on individual opinions regarding quality of public services, media, elections, social trust and the perceived and experienced meritocracy in the public and private sector.
Although the survey data can be used for national, as well as individual level analyses, the purpose of the survey is to aid scholars, practitioners and policymakers interested in going beyond comparisons and analyses at the national level, and to compare quality of governance across and within countries.
Sources
The surveys are conducted via telephone interviews, computer-assisted telephone interviews, and online. In 2017, the number of respondents per region was between 400 and 450. In the four waves of the EQI, there were roughly 330,000 respondents in total.
Strengths
The survey is intended to provide a more nuanced metric when comparing governance across political units in Europe and is the first to provide comparable quality of governance data that can be used to compare regions within and across countries. This is seen as significant given that variation in the quality of governance among European countries is more significant than in most other world regions.
Limitations
Because the survey questions are limited to those policy areas that are most often either governed or administered by sub-national bodies, the range of services assessed is necessarily narrow (namely, health care, education and law enforcement).
Global Corruption Barometer, Transparency International
https://www.transparency.org/en/gcb
Timeframe: 2003 - present
Frequency: every two or three years
What does it measure? How to use the results?
The Global Corruption Barometer (GCB) is a public opinion survey on perceptions and experiences of corruption. As a poll of the public, it provides an indicator of how corruption is viewed and experienced at national and regional levels and how efforts to curb corruption around the world are judged on the ground. It also provides a measure of people’s experience of corruption in the past year, in general and per institution.
The GCB can be used to identify public institutions and services that are seen as corrupt, to raise awareness to the impact of corruption on people in their everyday lives, and to better understand the political climate in a country as well as the integrity of national institutions.
Since 2017, the GCB has been conducted at a regional level with most recent surveys on the African region (2015-2019), Pacific region (2021), Asian region (2020), and European Union (2021). The move from a global survey to regional ones was to take a deeper look at the nuances of public perceptions and experiences within different regions.
Sources
For each regional survey, different methodologies apply. For example, for the 2021 Pacific region GCB, researchers reached out to respondents using computer-assisted telephone interviews to a sample generation, and face-to-face computer-assisted personal interviews. The results were post-weighted to align with national statistics. The sample size varied between 500 and 1,000 per country.
Strengths
The GCB is the largest cross-country survey to collect the public’s views on, and experiences of, corruption. The 2013 global edition surveyed over 114,000 people in 107 countries, the greatest country coverage to date. The survey is also carried out at a regional level which allows for more context specific questions to be included.
The GCB can be used to assess reform impact if there is a logical link between a reform intervention and the intended outcomes measured by the GCB, preferably combined with other data sources.
Limitations
The GCB gives a reference of people’s experience of corruption in various institutions but does not assess the institutional frameworks.
World Values Survey
http://www.worldvaluessurvey.org/wvs.jsp
Timeframe: 1981 - present
Frequency: approximately every five years
What does it measure? How to use the results?
The World Values Survey (WVS) started in 1981 and completed its seventh wave in 2022, from 2017 to 2022. It analyses changing values and their impact on social and political life. It is the largest non-commercial, cross-national, time series investigation of human beliefs and values ever assembled, currently including interviews with almost 400,000 respondents. As well as general questions on interpersonal trust and trust in institutions, there are also specific questions related to corruption.
The WVS seeks to help scientists and policymakers understand changes in the beliefs, values and motivations of people throughout the world. The data has been used to analyse such topics as economic development, democratisation, religion, gender equality, social capital and subjective well-being. These data have also been widely used by government officials, journalists and students, and groups at the World Bank have analysed the links between cultural factors and economic development (World Values Survey).
It measures views on corruption through questions on bribery for public services. It also asks respondents for their opinions on which groups of people are most involved in corrupt acts: state authorities, business executives, local authorities, civil service providers, and/or journalists and media.
Sources
The WVS consists of nationally representative surveys conducted in almost 100 countries since its inception which contain almost 90% of the world’s population, using a common questionnaire. Its most recent seventh wave released data for 59 countries and territories. Samples are drawn from the entire population of 18 years and older. The minimum sample is 1,200. The mode of data collection for WVS surveys is face-to-face interviewing with other modes (e.g., telephone, mail, internet) only used under very exceptional circumstances.
Strengths
The WVS survey collects a vast range of data on issues including environment, work, family, politics, society, religion, etc. It seeks to use the most rigorous, high-quality research designs in each country. The long time series (since 1981) allows for meaningful comparisons to be made over time
Limitations
The wealth of data can make the database difficult to navigate. It has also been criticised that the WVS survey oversimplifies complex social and political realities, leading to distorted results, and that there is a lack of contextual analysis of the empirical data (Lundgren n.d.). Additionally, for its measurement of corruption, it primarily focuses on bribery and petty corruption rather than a broader assessment.
Regional barometers
These regional barometers measure citizen perceptions of the social, political, and economic atmosphere in each country:
- Afrobarometer
http://www.afrobarometer.org/index.php - Eurobarometer
http://ec.europa.eu/commfrontoffice/publicopinion/index.cfm - Latinobarometer
http://www.latinobarometro.org/lat.jsp - Asian Barometer
http://www.asianbarometer.org/
Business surveys
Enterprise Surveys, World Bank
http://www.enterprisesurveys.org/
Timeframe: 2005 - present
Frequency: irregular
What does it measure? How to use the results?
The Enterprise Surveys measure firms’ perceptions of national business environments and experience with government processes, including informal payments and corruption. They capture business perceptions on the biggest obstacles to enterprise growth, the relative importance of various constraints to increasing employment and productivity.
Among other things, the Enterprise Surveys measure the percentage of firms that expect to engage in bribery to “get things done” in general terms, and for different services (water, electricity, etc.). The percentage of contract value as a gift to secure a government contract is also asked. They give an estimate of the number of businesses that consider corruption to be a major constraint for doing business in the country. The results are comparable across countries and over time.
Sources
Enterprise Surveys are conducted by private contractors on behalf of the World Bank. The Enterprise Survey is answered by business owners and top managers, as well as company accountants and human resource managers. Typically, 1,200 to 1,800 interviews are conducted in larger economies, 360 interviews are conducted in medium-sized economies, and, for smaller economies, 150 interviews take place.
Strengths
The Enterprise Surveys place corruption in the larger context of doing business in a country. They cover a large number of countries (154 as of November 2022). The data is comprehensive, based on a large sample of respondents, and covers both perceptions and experiences of corruption.
Limitations
The instrument used to collect data has undergone modifications and the country coverage has been expanded, requiring close attention to time comparisons of specific questionnaire items.
Global Competitiveness Report Executive Opinion Survey, World Economic Forum
https://www.weforum.org/reports/the-global-competitiveness-report-2020/
Timeframe: 1979 - present
Frequency: yearly
What does it measure? How to use the results?
The Executive Opinion Survey is the longest running (since 1979) and most extensive survey of its kind, capturing the opinions of business leaders around the world on a broad range of topics for which data sources are scarce or, frequently, non-existent on a global scale. Topics covered include the appetite for entrepreneurial risk, the extent of collaboration within a company or with external entities and the level of corruption.
The indicators derived from the survey are used in the calculation of theGlobal Competitiveness Index (GCI)and other World Economic Forum indexes and reports.
Sources
The Executive Opinion Survey is administered in a variety of formats, including face-to-face or telephone interviews with business executives, mailed paper forms and online surveys. Most questions in the survey of 80 questions ask respondents to evaluate, on a scale of 1 to 7, one particular aspect of their operating environment. The 2020 survey captured the views of 14,303 business executives between February and July 2020. After the data editing process, 11,866 responses were used from 126 different countries and territories.
Strengths
The sampling guidelines for the survey aim to reflect in the composition of surveyed companies the economic structure of the country while maintaining a 50% share of respondents from previous years to allow for year-on-year comparisons. The survey also aims to capture the diversity of companies in terms of ownership and economic sector.
Limitations
The sample size used is relatively small. For example, in the 2018 edition only 56 respondents were used, and the reliability of the data can be questioned, for example in authoritarian regimes.
Summary of assessment tools
Aggregate indexes
Basel Anti Money Laundering (AML) Index. Basel Anti Money Laundering (AML) Index, Basel Institute on Governance. (Methodology here).
Berggruen Governance Index. UCLA Luskin School of Public Affairs and Berggruen Institute. (Methodology here).
Corruption Perceptions Index. Transparency International. (Methodology here).
Democracy Index. The Economist Intelligence (EIU) (Methodology here).
Financial Secrecy Index. Tax Justice Network. (Methodology here).
Fragile States Index. The Fund for Peace. (Methodology here).
Global Corruption Index. Global Corruption Index, Global Risk Profile. (Methodology here).
Global Organized Crime Index. Global Initiative Against Transnational Organized Crime. (Methodology here).
Global State of Democracy Indices. International IDEA. (Methodology here).
Ibrahim Index of African Governance. Mo Ibrahim Foundation. (Methodology here).
Index of Public Integrity. ERCAS and Hertie School of Governance. (Methodology here).
Public Integrity Indicators. OECD. (Methodology here).
Rule of Law Index. World Justice Project. (Methodology here).
TRACE Bribery Risk Matrix. TRACE International. (Methodology here).
Varieties of Democracy (V-Dem). V-Dem Institute. (Methodology here).
World Governance Indicators. World Bank. (Methodology here).
Expert country assessments:
Africa Integrity Indicators. Global Integrity. (Methodology here).
CIVICUS Monitor. CIVICUS. (Methodology here).
Country Policy and Institutional Assessment. World Bank. (Methodology here).
EuropPAM. ERCAS. (Methodology here).
Exporting Corruption Report. Transparency International. (Methodology here).
FATF Mutual Evaluations. The Financial Action Task Force. (Methodology here).
Freedom in the World. Freedom House. (Methodology here).
Global Right to Information Rating (RTI). Access Info, Centre for Law and Democracy. (Methodology here).
Open Budget Survey and Index. International Budget Partnership. (Methodology here).
Open Data Inventory. Open Data Watch. (Methodology here).
Press Freedom Index. Reporters without Borders. (Methodology here).
Sustainable Governance Indicators. Bertelsmann Foundation. (Methodology here).
Transformation Index. Bertelsmann Foundation. (Methodology here).
Transparency Index. ERCAS and Hertie School of Governance. (Methodology here).
Public opinion surveys
Afrobarometer. (Methodology here).
Asian Barometer. (Methodology here).
European Quality of Government Index. Quality of Government Institute. (Methodology here).
Eurobarometer. (Methodology here).
Global Corruption Barometer. Transparency International. (Methodology here).
Latinobarometer. (Methodology here).
World Values Survey. (Methodology here).
Business surveys
Enterprise Surveys. World Bank. (Methodology here).
Global Competitiveness Report Executive Opinion Survey. World Economic Forum. (Methodology here).