
I. Introduction: Using corruption measurement and assessment tools in development programming
Development practitioners routinely encounter corruption as a key obstacle to achieving their programming objectives and confront questions such as: How serious is corruption in the country and sector in which we are working? Is it getting worse or better? What corrupt actions are taking place and where? Who are corruption’s victims, perpetrators, and opponents, and how do the systems in which they operate facilitate, drive, or discourage corruption?
Corruption research has responded with a plentiful supply of indices, scores, rankings, and assessments to help answer them. Assigning scores and creating profiles of legal frameworks, institutional arrangements, and other characteristics that facilitate or constrain corruption is now a major research area, but how should development practitioners use this information to solve the real-world challenges of designing, implementing, monitoring, and evaluating programmes?
This guide is for development practitioners interested in using corruption-related measurements and methodologies to analyse the problem as well as to design and monitor programmatic responses. Section II provides an overview of different types of tools, while Section III covers characteristics of these tools that affect their utility for diagnosis of the corruption problem and designing and monitoring programmatic responses. Section IV provides specific guidance on how development practitioners can use these tools in the daily work of development programming, while Section V summarises some essential lessons. This guide is not an inventory or evaluation of corruption measurement and assessment tools; very good ones already exist.b0733d352ac6

Vital questions about corruption measurements and assessment tools
Throughout the paper, text boxes will address five vital questions of interest for programmers, and how corruption measurements and assessments can – and cannot – be used to answer them:
1. How can we observe or document changes in the level of corruption?
2. How does corruption affect men, women and children living in poverty?
3. What are the causes of corruption?
4. What can be done to reduce corruption?
5. How can we protect aid funds from risks of corruption or fraud?
II. Types of corruption measurement and analytical tools
The analytical tools that programmers will be interested in generally fall into two categories: those that attempt to ‘measure’ corruption, and those that assess contextual factors that contribute to corruption.
- Corruption ‘measurements’ generally attempt to quantify the extent of corruption in different ways.
- Assessments and assessment methodologies, by contrast, aim to describe the characteristics of a given context – system shortcomings (and strengths) and political, economic and social factors – that enable and sustain corruption.
This section summarises the types of measurements and assessment tools available, provides examples, and offers a few considerations on using these tools. Annex 1 includes more information of each example listed in this section, along with many others, including descriptions of their focus, coverage, methodology, strengths, and limitations.
A. ‘Measuring’ corruption
Corruption is often described as a ‘hidden phenomenon,’ though in fact its presence is often common knowledge. Corrupt behaviour is not something that participants willingly expose for just anyone to see – let alone quantify. That is one of the main reasons we are never in a position to accurately ‘measure’ corruption itself, but there are other challenges, too.
What aspects of corruption should one ‘measure’? Different types of corrupt practices – for instance, administrative corruption versus grand corruption – require different approaches due to their differing impact on society. In the case of informal payments for services or sexual exploitation, the scope of incidence is more relevant than the monetary value when considering the immediate impact on women and the poor. With grand corruption, the scope of incidence is perhaps less relevant than the financial amount of bribes and the scale of illicit enrichment of corrupt officials, not to mention the longer-term effect on the economy.
Different corruption ‘measurement’ tools consequently attempt to quantify different types or aspects of corrupt practices. Some count reported victimisation (‘experience’), others survey opinions of experts and broader populations (‘perceptions’), while others track certain types of administrative data (eg, the number of procurements conducted in accordance with key procedures). These different measurements may be grouped generally into countable statistics and indices typically constructed from multiple data sources.
The seduction of quantification
An important debate is emerging about the pros and cons of counting things and creating quantitative measurements to describe complex social phenomena (see Merry 2016). In its pursuit of evidence to demonstrate effectiveness and impact, the international development field has embraced the quantification trend, and the sheer number of measurements in Annex 1 is proof that the anti-corruption field is no exception.
Criticisms of quantification include the fact that such measures usually only partially describe the range of factors that contribute to a certain societal characteristic (eg, respect for human rights, effectiveness of governance, or levels of corruption), that they tend to accentuate things that are ‘countable’ rather than things that are not, and that they may embody biased (or at least hidden) assumptions about how change happens and what is most important for a society.
These criticisms are certainly relevant to corruption measurements, and this guide seeks to highlight the weaknesses of various approaches, along with what they can do. The most important lesson, restated at the end of this guide, is that practitioners must not use corruption measurements uncritically, but rather must explore methodologies and assumptions for themselves and complement measurement with other types of assessment, in order to avoid the worst risks of our attraction to quantification.
Corruption-related statistics: The following types of data are all ‘countable,’ but their resemblance to hard data does not mean they are necessarily good measurements of corruption. (These measurements are not included in the Annex 1 table because they are specific to a given country and not available in any specific format or central information source.)
| Type | Description | Examples | Considerations |
|
Administrative |
Characteristics of government or its performance relevant to corruption or anti-corruption outcomes |
|
This information is hard data insofar as it is ‘countable,’ but there may be issues with reliability of data reported internally by the government, especially if it is not audited for accuracy. |
| Criminal or legal statistics |
Data on corruption complaints, investigations, prosecutions, convictions |
|
This data is ‘countable,’ but unreliable as a corruption measure because: --much corruption goes unreported --more arrests or convictions may reflect more anti-corruption efforts, but not necessarily more corruption |
|
Population |
Survey data on corruption perceptions or experience (also called victimisation surveys) |
|
More reliable to the degree that the surveys are well-designed and executed and terms are carefully defined.* However, corruption perceptions are unpredictable and are not good measures of anti-corruption progress on their own. ** Experience surveys may be more reliable in tracking changes, but they also suffer from under-reporting. Experience surveys ask about only a few specific types of corruption (usually bribery) and therefore may not represent the actual ‘amount’ of corruption. |
* For example, a survey asking if a person has been the ‘victim of corruption’ or asks her perception of ‘in which institutions corruption is worst’ leaves open a wide range of possible interpretations of corruption. Surveys that ask if a person has been asked to pay a bribe narrows down the definition of corruption effectively, but at the same time may lose information on where people experience or perceive other types of corruption.
** For example, the perception of corruption may rise when a scandal, or a major corruption trial, puts corruption in the news, though this says nothing about the actual level of corruption before or after the scandal or trial.
Corruption and governance indices: The most well-known and widely-used resources, typically contain scores or grades – quantified values assigned to qualitative characteristics. Many are also hybrids – part measurement and part qualitative assessment – converted into scores.
Corruption and governance indices
|
Type |
Description |
Examples |
Considerations |
|
Composite |
|
|
|
|
Framework- |
|
|
|
|
Sector |
|
|
|
Proxy indicators: These are context-specific measurements that have been shown to be related to aspects of corruption in a certain context. Proxy indicators are not comparable across countries, but are usually created to assess the effects of specific reforms or programmes in a given country (Johnsøn and Mason, 2013). Developing effective proxy indicators requires first establishing that corruption significantly affects a particular outcome in specific settings, then measuring the difference in that outcome after anti-corruption efforts have been implemented.
One benefit of proxies is that they may be able to measure changes in less countable types of corruption, such as high-level embezzlement of public funds.b79937a7bb0d
Proxy indicators
|
Type |
Description |
Examples |
Considerations |
|
Proxy |
Context-specific measurements of characteristics shown to be related to corruption, though not specifically about corruption themselves |
|
Proxy indicators are only useful as corruption measurements if the situation they measure (leakage in funds transfers, poor ratings in user surveys, high government costs vs. market rates, new businesses getting government contracts, low number of clinic visits) is previously shown to be related to corruption. Proxy indicators are context-specific and not comparable across countries. |
* See U4 Brief Proxy indicators for the corrupt misue of corporations.
Important
Never take a corruption data point at face value. Always familiarise yourself with the sources and/or methodology of a corruption measurement so that you know what it is actually telling you.
- Comparability across time or countries can rarely be assumed. How often data is collected, whether the same data sources are available for all countries, whether the same data collection or aggregation method is used across countries or over time, and the margins of error all determine the degree of comparability of corruption measurements.
- Digging below the surface may also reveal lower-level data points that are more relevant to your needs than the overall index or score.
Lessons
The fact that we can’t measure corruption directly has important implications for programming:
- Because ‘corruption’ comprises many forms and practices across the public and private sectors, no single tool can account for the full scope of the problem.
- As each tool provides limited information, multiple sources are needed to construct a more comprehensive picture of the corruption challenges.
- Statistics, scores and indices cannot describe the legal, institutional, social, and political facilitators and drivers of corruption. Such information, however, is needed to interpret the relevance and implications of measurements.
- Different measurements, scores and indices will be relevant for different functions in the project cycle. (See Section IV)
Vital Question 1. How can we observe or document changes in the level of corruption?
This is one of the most difficult challenges in anti-corruption work. As discussed here, corruption cannot be directly measured, so assessing changes in corruption is a matter of choosing carefully among different proxies and estimates. A good rule is never to rely only on a single measurement. Some options include the following:
- Perception surveys can be compared with experience or victimisation data. If perceptions of corruption are going up, but people are not reporting that they are asked for or pay bribes more often, this may suggest that reports of high-level corruption are driving perceptions instead of actual low-level extortion or bribery.
- Data points such as surveys should be compared with the context. Did perceptions of corruption in the judiciary go up (more than perceptions of other institutions) at the same time that there was a public scandal in the judiciary? Did perceptions of declining corruption in procurement coincide with news of a review of contracts that saved the government a lot of money? Such signals might help clarify whether the perception data is telling a complete story of what is really happening in a country.
- Develop proxy indicators. Bespoke indicators that reflect changes in the specific outcomes certain corrupt behaviours affect can be the most effective means for measuring changes in corruption levels in specific functions or sectors.
- Don’t rely on measurements alone. Qualitative assessments shed more light on numbers: if nominal reforms have been effectively implemented, if intimidation is discouraging use of a reporting mechanism, or if corruption has taken a new form in order to side-step a newly-monitored procurement process.
B. Assessing context
In addition to ‘measuring’ corruption, we can also assess the legal, institutional, and social frameworks that are thought to facilitate or discourage corruption, as well as the broader political economies and social norms that drive corrupt practices.
Assessing the context is important because anti-corruption programming should not just duplicate models from elsewhere and expect they will work. Context – from the capacities of various institutions and specificities of legal frameworks to the alignment of vested interests and expectations of citizens – is paramount for assessing what is appropriate and feasible in programming. Corruption measurement and assessment tools can be used to understand context by identifying:
- sectors and functions where corruption is prevalent,
- gaps and weaknesses in legal, regulatory, and institutional arrangements that typically help control corruption,
- attitudes and expectations that may perpetuate corruption and make it harder to address, and
- stakeholders, as well as their interests and power/resources, who may affect the opportunities and constraints for anti-corruption efforts.
Some context assessments are mainly qualitative, such as Corruption Vulnerability Analyses and political economy analyses of corruption. Others may assign values or scores to the quality of the context – thus becoming indices as described above (eg, Doing Business, Bertelsman Transformation Index, etc.). The combination of scores and narrative reports is particularly informative and useful because it not only facilitates the assessment of comparability, but also illuminates the details of a given situation. Some assessments also include comparisons of how well ‘de jure’ rules are applied ‘de facto (eg, Africa Integrity Indicators), which is particularly helpful for looking beyond rules to their actual implementation. However, this approach is less common.
Lesson
Context assessment is always important as a first step in programming. In order to designing programmes and measurements that will allow the best assessments of progress, it is critical to know the types of corrupt behaviours that are common in the targeted sector or institution, the institutional and legal arrangements that facilitate those behaviours, the relationships and power dynamics that drive corruption, and the stakeholders who may promote or hinder change.
III. Important characteristics of measurements and assessment tools
When choosing corruption measurements and assessments for various programming purposes, practitioners should consider several important characteristics that affect their utility.
A. Disaggregated vs. aggregated information
Some indicators, especially indices that give a single score for a country or sector, may not be easily disaggregated to identify where, exactly, corruption problems exist. For instance, the Transparency International CPI and the WGI Control of Corruption indicators provide country ‘scores’ and rankings, but even with the source data and methodologies now available, a clear disaggregation of key problem areas is difficult. By comparison, the Global Integrity Africa Integrity Indicators issues a report for each country that breaks down the single score into constituent parts covering various anti-corruption functions and systems. Other framework-based indices also provide sub-scores on a number of different factors that help clarify and focus the analysis of corruption challenges. Similarly, the TI Global Corruption Barometer includes questions about perceptions of corruption across various institutions and experience of corruption in a range of public service areas, as do some of the regional ‘barometer’ public opinion surveys.
Lessons
- Disaggegated (or ‘disaggregate-able’) measures are almost always more informative for problem diagnosis, programme design, and monitoring than are aggregated measures. They facilitate making more direct connections between specific problems and programmatic responses, and between programmatic inputs/outputs and anti-corruption outcomes and results.
- Scores that already focus on specific sectors or functions (Open Budget Index, Rule of Law Index, etc.) can be more useful for focused programme design and monitoring than those that cover a country’s entire system (see section below).
- To assess impacts of corruption and of anti-corruption programming on marginalised groups or to focus on gender or poverty-related outcomes, look for surveys and other data that is or can be disaggregated by gender, location, income level, etc. (See text box on how corruption affects men/women/children in poverty.)
Vital Question 2. How does corruption affect men, women, and children living in poverty?
The differential impact of corruption on people of different genders and income levels is important information for programming aimed at empowering women, protecting children, ameliorating inequality, and/or reducing poverty, among other objectives. The question of how corruption affects men, women, and other groups differently involves several issues, including power disparities and exposure to different demands or requirements for participating in corruption.
Many types of corruption thrive where some people can exercise power over access to services or functions that others need (eg, permits, licenses, health services, exam scores, water, or electrical connections) or where power is exercised even more directly (police interactions, court proceedings). When the victims in these cases are poor, their lack of financial, political, or social resources and lack of alternative means of meeting their basic needs exacerbate their exposure to corruption and put them at even greater disadvantage in seeking redress.
Gender identity, age, and social status also affect the type of corruption that a person is exposed to and their responses to it. Data is not extensive, but in some surveys in Latin America and Africa, men report paying bribes slightly more often than women do (though much of the difference applies to police corruption and getting documents and permits), making them perhaps more frequently the direct victims of corruption.* However, data that only focuses on monetary bribery overlooks sexual favors and extortion as a type of ‘payment,’ in which women and other disadvantaged groups are more frequent victims. Further, this data doesn’t account for the indirect impact of corruption, such as the fact that corruption in public services – including grand corruption that reduces supplies of needed services – is likely to affect women more than men due to their role as family caretakers. Corruption in the police and the judiciary can also maintain gender imbalances by failing to enforce laws that protect women, children, and other disadvantaged groups. Corruption in politics reduces women’s access to public office, thereby perpetuating under-representation of women in many developing countries.**
Corruption measurements can assist our understanding of the impact of corruption on men, women, children, and other disadvantaged groups if information is disaggregated by these characteristics. Population surveys of perception and experience (victimisation), such as the Global Corruption Barometer, generally do this, but other standard measurements are not as useful in this regard. Locally-generated data, such as user surveys or monitoring of participation in community scorecard or citizen report card activities, can provide insights on how different groups participate in anti-corruption efforts or how they experience corruption in specific settings. More qualitative analyses would be required to unpack the indirect effects of corruption on different groups.
* See Boehm and Sierra 2015.
** See Transparency International’s Topic Guide on Gender and Corruption (https://knowledgehub.transparency.org/guide/guide-3/4414)
B. Focus on a single sector/function or a general system
In anti-corruption work, the ‘problem’ may be corruption itself (eg, how a country can reduce the prevalence of corruption or respond to a wave of scandals), or it may be the negative impact of corruption on some other development goal, such as environmental protection, health care, public security, or effective public financial management.
To assess ‘corruption’ as a general systemic problem, the major perception and experience surveys, criminal data, framework-based indices (eg, Ibrahim Index of African Integrity) or broad system studies (eg, TI National Integrity System, UNCAC reviews, and gap analyses) may be helpful. Function-oriented indices such as the Open Budget Index, Rule of Law Index, or PEFA can also be relevant for system-wide diagnoses, as they assess important elements of an anti-corruption system across all structures and functions of government.
To analyse corruption challenges in specific sectors or institutions, look for specific sector indices and analyses (eg, WHO’s Pharmaceutical System Transparency and Accountability Assessments, or Tax Administration Diagnostic Assessment Tool) and/or general/composite system indices and studies that can be disaggregated. Tools such as corruption vulnerability assessments, political economy analyses, citizen report cards, community scorecards, and user surveys can also target different sectors and governmental functions to dig deeper into the processes, dynamics, and citizen experiences of corruption in the focus area. Disaggregated (or disaggregate-able) public and expert surveys sometimes include information on specific public services or institutions.
Lesson
Broad/general system studies and sector-specific analyses complement each other in the sense that a general system study is, essentially, a compilation review of key functions recognised as vulnerable to corruption, or necessary to control it.
For sectoral work beyond these key functions – including seemingly unrelated fields like environmental protection or water and sanitation – it is important to remember that corruption and reform in a particular sector or function of government may be influenced by factors outside the immediate sector or function. Relying on sector or function descriptions alone, especially if they only identify weaknesses in the legal and institutional framework, may overlook important elements of the broader system that help explain certain corruption problems. For example, leakages in a health care system may be facilitated by weaknesses in ‘cross-cutting’ functions such as public financial management or procurement. Concentration of the business sector in a few families could create risks for collusion, price fixing and conflict of interest in procurement that would not be identified only by analysing the procurement rules themselves.
Internationally-generated data vs. homegrown sources
The noted assessment and measurement tools may not contain data on your country of interest, or the data may not be recent enough for programming purposes. Even internationally-generated indices and surveys are not always global in scope and not performed annually.
Many of the tools noted here are methodologies that can be applied and/or adapted as needed for the specific country or sectoral context.
C. Static vs. dynamic analysis
For development practitioners, perhaps the most important difference among measurements and assessments is whether they describe the status quo in a static way or illuminate the dynamics that drive corrupt behaviours and create opportunities for and constraints on reform.
Static analyses – including all scores, survey data, rankings and indices – but also including some corruption vulnerability assessments, other institutional studies and broad system studies – take a snapshot of what is, whether that is perceptions, laws, institutional arrangements, or reported experience. As such, they can be used to compare the performance or characteristics of a country, sector, function, or institution to another one or to the same one at a different
point in time, provided the methodology is consistent over time and across jurisdictions. This makes static analyses useful for programming functions like:
- Problem definition and programme design/appraisal: Assessing the overall seriousness of corruption problems; assessing the gaps and needs in a legal or institutional framework for controlling corruption.
- Monitoring: Depending on the specificity and sensitivity of the data, static analysis may be useful for monitoring outcomes of a programme. Aggregate indices and broad survey data, however, are unlikely to reflect changes resulting from specifically focused programmes.
- Evaluation and learning: Comparing ‘before and after’ to assess the outcome and impact of a programme, again only as long as the data is specific and sensitive enough to be reasonably linked to the programme.
Important
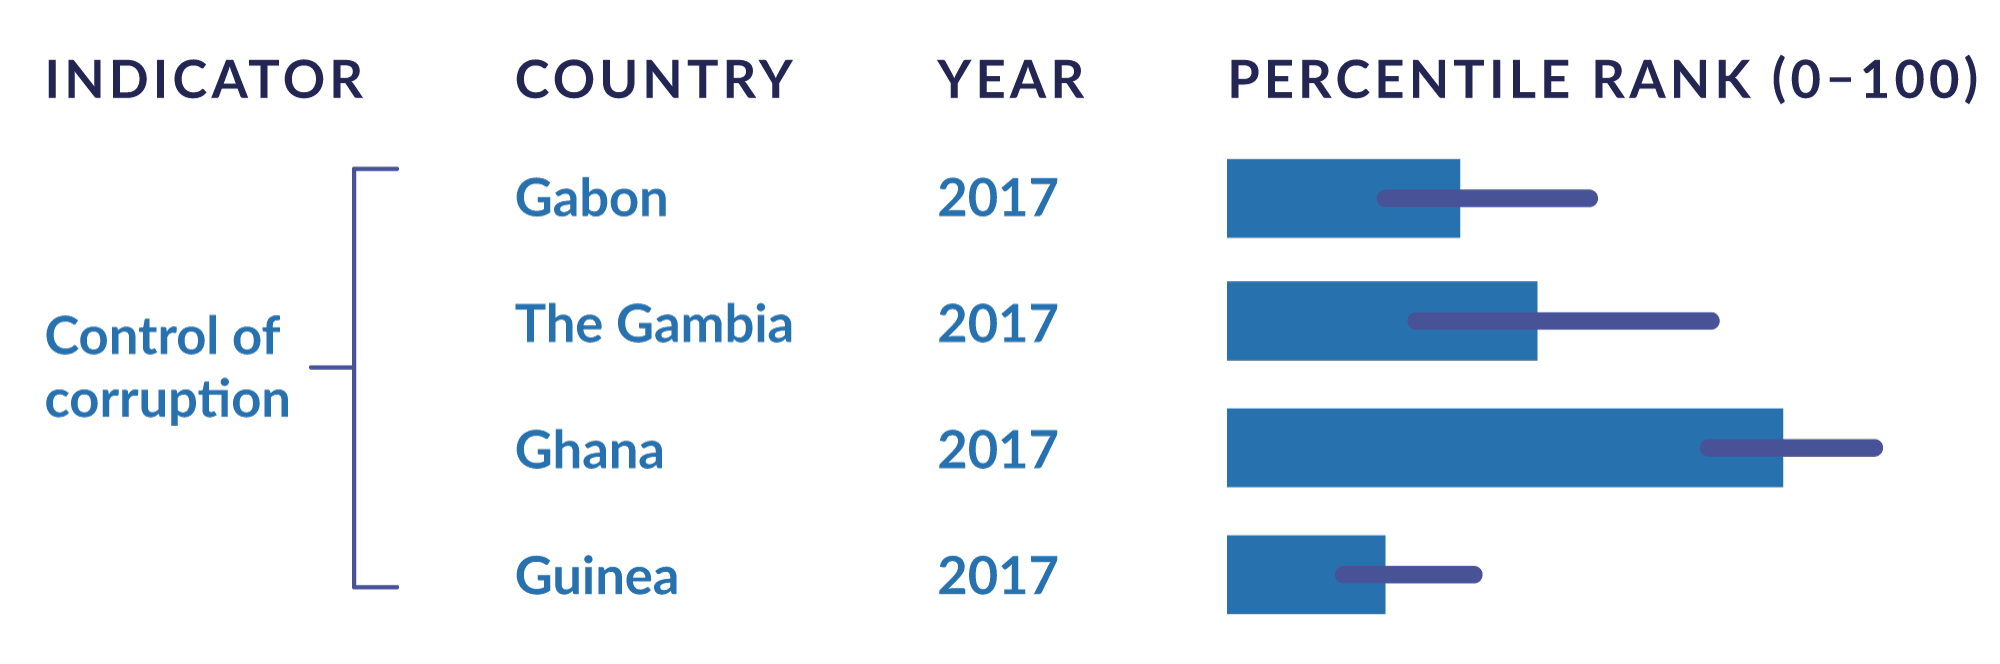
Remember that comparisons can only be made across time or jurisdictions if the methodology of the measurement is consistently used and does not involve time lags or differences in source data. In Figure 1, for example, the black bars show the margins of error for the popular WGI Control of Corruption indicator – demonstrating that while countries’ scores (percentile rank) may be quite different, the uncertainty associated with each score renders these differences much less meaningful than they may first appear.
Figure 1: WGI Control of Corruption – margins of error
The PEA Topic Guide site from the Governance and Social Development Resource Centre is an excellent resource for exploring the theory and application of PEA. It includes
- background on the PEA approach
- case studies of development cooperation projects/programmes that have been informed by PEA
- tools and guidance for conducting PEAs at the national and sectoral level
- examples of PEA reports, including a range of sectoral PEA studies covering public service delivery, disaster risk management, economic growth, and extractive industries
(See http://gsdrc.org/topic-guides/political-economy-analysis/)
If statics tell us what is, dynamic analyses seek to illuminate why it is and how change might happen. The tools of dynamic analysis are informed by a political economy understanding of how systems work. Political economy approaches examine the currents of social, political, and economic power and interests that shape the institutions, laws, and processes that static analyses portray at a given point in time. Political settlement analysis (PSA) is a form of political economy-informed analysis that focuses particularly, but not solely, on ways that countries emerge from violence and the alliances of elites that create the basis for political stability. (Kelsall 2016, Leftwich and Laws 2016, see also DFID 2015: 20-21 specifically on corruption and political settlements). Dynamic studies, including PSAs and PEAs, also examine informal institutions and relationships as well as formal ones. These analyses can be done at the national level (see, for example, Roy 2017) or in sectors (eg, Kelsall, Hart and Laws 2016), or they can focus on a certain function of government (see, for example, Hassan and Prichard 2016).
Dynamic analyses can be one-off studies, or they can include processes that revisit the analysis over time7f1f2a86d720 Corruption may not even be the specific focus of a political economy analysis, but corruption problems, if they are material to the subject of the study, will usually come upafc2cc321f3a Finally, a dynamic approach to corruption analysis may also seek to uncover the underlying functions that corruption might play in holding together political coalitions, preserving power distributions, or, for average citizens, resolving access problems caused by poor governance (Marquette and Peiffer 2015).
The benefits of dynamic analyses for programming are especially important to the following programming functions:
- Problem definition and programme design/appraisal: Identifying underlying dynamics that may be more relevant than formal legal and institutional frameworks for perpetuating corruption; identifying politically more feasible reform options based on the interests and powers connected to various options
- Implementation and monitoring: Creating more effective theories of change that clearly identify assumptions and risks and allow for better understanding of implementation problems and opportunities.
- Evaluation and learning: Understanding why expected changes took place, why they didn’t, or why unexpected positive or negative outcomes occurred.
Lessons
- Static analyses identify needs and gaps in systems.
- Dynamic analyses identify opportunities and constraints for meeting needs and filling gaps.
- Dynamic analyses are essential for assessing what types of reforms are likely to be appropriate and feasible in different settings.
- Static scores, counts and analyses are more useful for monitoring progress, but may not help you understand why progress is or is not taking place.
IV. Using measurements and analytical tools in development programming
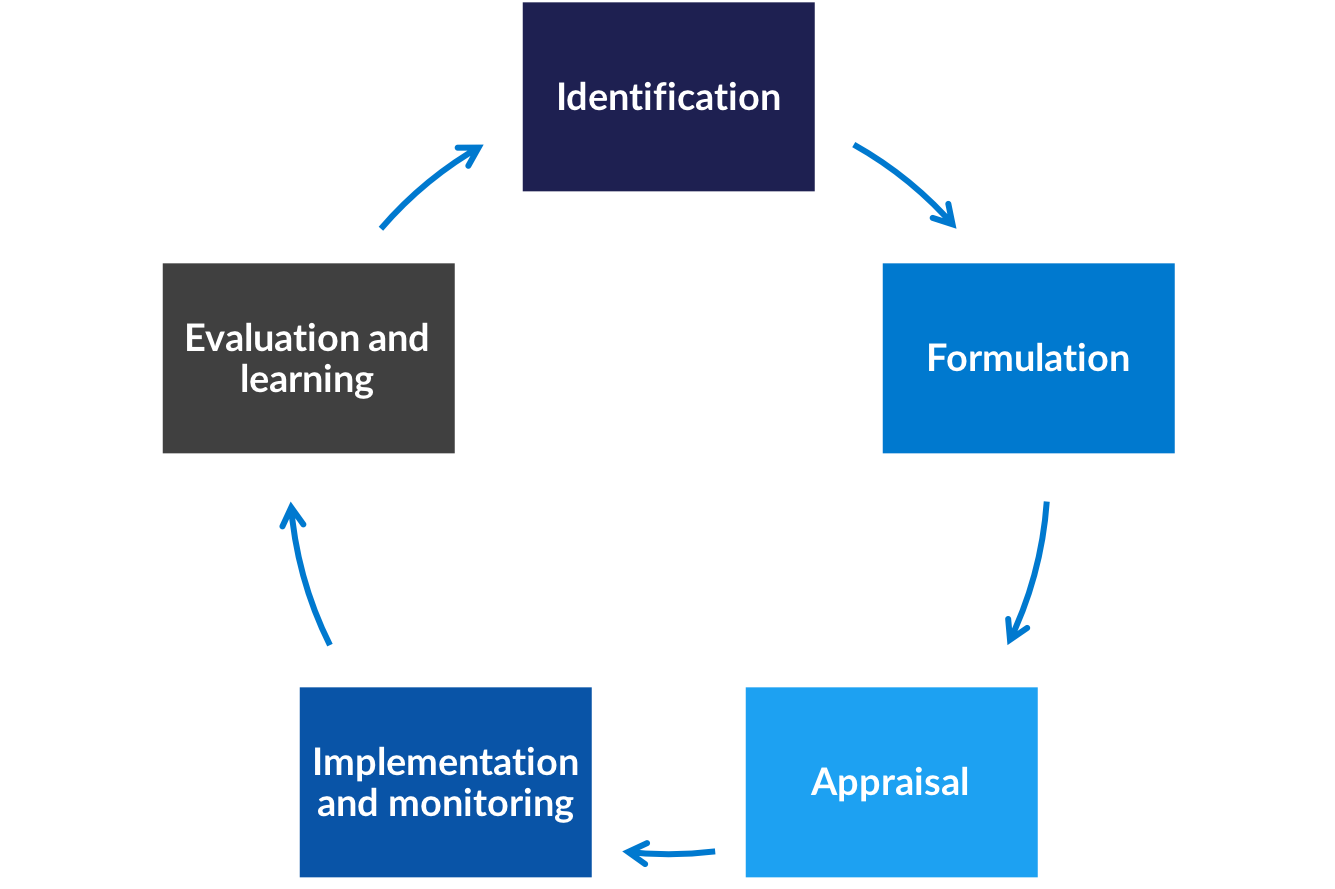
Because corruption may be an obstacle to achieving programme objectives in any sector, evaluating its scope and potential threat to programme outcomes should be routinely integrated in the programming cycle. This section explains how measurements and assessments/tools can fulfill different purposes in development programming, using the framework of a generic project cycle (Figure 2). The table in Annex 2 is a summary of this section, with more suggestions of specific measurements and assessments.
Figure 2: The project cycle
A. Problem identification
The problem identification stage of a project typically involves a broad look at the targeted issue – corruption in this case – to assess its seriousness and impact.
1. Key questions
Important questions for problem identification, as well as information sources to help answer them, are detailed in Annex 2. Key questions include:
- How serious is the corruption problem in this country? How does this country compare to others in terms of general levels of corruption? Is the problem getting better or worse?
- How is corruption affecting our development objectives? In what sectors/functions is corruption most prevalent? How prevalent is it in our specific area of concern, and what are the potential impacts?
2. Relevant corruption measurements and assessments/tools
At this highest level of analysis, measurements and assessments that rate one country against another may be useful to answer the first question, though especially global composite indices have large margins of error that make them unsuitable for making distinctions among countries with similar scores. Equally, small changes in scores over time do not usually indicate meaningful changes in the corruption situation.47c6e02229d9 Multi-country framework-based indices (Africa Integrity Indicators, Sustainable Governance Indicators, etc.) can be used to compare specific elements of a country’s governance or integrity system to those of neighbors or income peers.
Multi-country population surveys may help place the country in terms of how its population experiences or perceives corruption; those that ask disaggregated questions about the specific services and institutions in which people experience corruption (e.g., Global Corruption Barometer, some of the regional barometer surveys) will help programmers begin to identify problem areas within a country, which can also illuminate how corruption may affect certain development objectives.
Issue-focused global surveys will highlight how a country is doing vis-à-vis its peers with regard to specific functions like business regulation (Doing Business), resource governance (Resource Governance Index) or perceptions of the country’s competitiveness around the world (Global Competitiveness survey). Information from issue-focused surveys can also help programmers begin to identify the risks of corruption to a specific issue or objective the survey covers.
Administrative data such as contracting costs, health surveys, or performance data from clinics or schools can be combined with focused framework-based indices or population surveys to estimate the effects of corruption on particular sectors. Qualitative sector or function assessments may also provide indications of this impact, while locally-generated data like community scorecards or user surveys can identify problems in how citizens perceive or experience particular public services or functions. Such data can be particularly useful for sectoral programming, however their methodological validity should be scrutinised. And any data that is disaggregated by gender, age, region, race, or ethnic identity can help illuminate the potential impact of corruption on objectives such as women’s empowerment, youth employment, or rural livelihoods.
Vital Question 3. What are the causes of corruption?
Corruption is not caused by any one factor. We can sort the many causes into two categories of facilitators and drivers. Weak systems, poor oversight, and scant enforcement all facilitate corruption by creating opportunities that can be exploited and the expectation that violations will not be detected or punished. Poverty, greed, social pressures, the demands of financing political campaigns and coalitions, or the expectation that ‘everyone is doing it’ can all drive corruption by providing justifications and pressures for people to engage in corrupt actions.
Corruption measures and assessments can’t necessarily explain what is causing corruption in a given country, sector, institution or public function, but they can provide indicators of both facilitators and drivers.
Facilitating factors can be identified by framework-based assessments and indices that set out the gaps and weaknesses in anti-corruption systems and structures. Examples include assessments of public finance architecture (PEFA), openness of government and budget processes, access to information, and the rule of law.
The usual means of illuminating corruption drivers are analyses of political dynamics, of stakeholders and their interests and power, and of attitudes and social norms. Political economy analyses may be the most effective to understand political dynamics, as well as stakeholders’ interests and power. Opinion survey data, meanwhile, may illuminate attitudes. For example, the Global Corruption Barometer (GCB) surveys reactions to statements like ‘Ordinary people can make a difference in the fight against corruption.’afed375970d0
An important new approach is to analyse the functions that corruption can serve, such as holding together a political coalition or solving the problem of access to an under-supplied service like health care, education, or electricity. These functional aspects of corruption can help explain why it exists and especially why it can be so hard to eradicate. (Marquette and Peiffer 2015)
B. Project formulation and project appraisal
At the formulation stage, plans are developed to address selected challenges that corruption presents. Appraisal then assesses, among other things, the feasibility of implementing the programme and likelihood of achieving the desired results. While formulation may focus more on what gaps need to be filled and how to fill them, appraisal requires understanding of the stakeholders that may be involved in or affected by the programme and its objectives, their interests and relative power, as well as other informal factors that may drive corrupt behaviours targeted by the programme. However, these same considerations should also be taken into account when designing programmes, thus the two phases are presented together here.
Project formulation and project appraisal
|
Formulation |
Appraisal |
|
|
Relevant characteristics of the context |
Needs and gaps in laws, regulations, resources and practices that affect corruption outcomes |
Stakeholders involved in filling gaps and improving practices; their interests and resources/power; informal dynamics that shape interests |
|
Outcome of this stage of project cycle |
Plan to address needs and gaps |
Assessment of feasibility of plan; revision of plan |
1. Key questions
Important questions for design and appraisal and information sources to help answer them are detailed in Annex 2. Design questions may include:
- What can be done to reduce corruption at the overall system level? What are the key gaps in the system that facilitate corruption? Where do people experience or perceive greater corruption? What underlying factors drive or motivate corruption?
- What is needed in order to reduce corruption in a given sector or governmental function? What are the most prevalent corruption problems in this sector/institution/function? Where are the key weaknesses in the legal and institutional arrangements? Who are the important stakeholders and how do their interests align with/against reform?
Appraisal questions include:
- Is a particular institutional, legal or programmatic focus likely to be implemented and/or have an impact? What are the chances of this reform effort being accepted by key stakeholders? Who are the potential beneficiaries or allies of the proposed changes? What is the relative power of actors with interests in line with or at odds with the reform?
Vital Question 4. What can be done to reduce corruption?
Corruption measurements and assessments can help answer this question in two ways:
a) Identifying gaps in legal and institutional frameworks that facilitate corruption, and
b) Identifying causes or drivers of corruption such as political dynamics, social norms, or economic pressures.
Section IV.B explained how various sources can be used for these purposes. However, identifying gaps that need filling as well as the opportunities and constraints to filling them is only part of the picture. Corruption measurements and assessments cannot answer how gaps should be filled or drivers addressed – ie, what reforms or programme approaches are most likely to lead to the desired outcomes. This element of design requires knowledge of the many different reform options and experiences related to the topic of concern, consideration of the specific conditions that have made those approaches successful elsewhere, and assessment of the degree to which similar conditions apply in the current context. Several overviews of ‘what works,’ mainly based on donor experience, are available (see, among others, DFID 2015, UNDP 2014, USAID 2014, USAID 2015, Borges, et al. 2017), but it is essential to remember that ‘what works’ in one setting may not in another.
2. Relevant corruption measurements and assessments
Designing effective anti-corruption programmes requires 1) filling identified gaps and weaknesses, but also 2) planning to address attitudes and expectations about corruption, and 3) taking into account the power and interests that may be aligned for and against needed reforms.
For design purposes, then, the most useful tools are indices and surveys that can be disaggregated to identify specific weaknesses in the legal and institutional arrangements at the desired level of intervention (eg, national vs. local/sectoral/functional), along with assessments and surveys that illuminate problem areas and reasons why people participate in corruption or resist change:
- Gaps (national): National-level studies and indices (eg, TI National Integrity System studies, regional group reviews like GRECO, Africa Integrity Indicators) can be used to prioritise problem areas in the overall anti-corruption system, while survey data can identify areas where people experience or perceive more corruption.
- Gaps (sectoral/functional): Similar sources for sectors or specific government functions (eg, CPIA, PEFA, Open Budget Survey/Index, Resource Governance Index) provide more specifics on the strengths and weaknesses in these areas.
- Attitudes/norms/functions: Dynamic assessments (political economy analyses) that explore the underlying drivers of corruption help inform programme design with insights on norms, expectations, relationships, and functions that corruption may play. Survey data may provide information on attitudes about corruption or illuminate why people participate.
- Opportunities/constraints: Political economy and stakeholder assessments that identify key stakeholders and their interests, power, and resources should be used to gauge the feasibility of different reforms and implementation approaches, and to search for issues that may create a coalition of shared interests.90df06d8bdc3
Many of these same tools can be used for programme/project appraisal. At this stage, the opportunities and constraints for achieving the desired outcomes, as shaped by the interests and powers aligned for and against targeted changes, is more important than gaps in the system.
Lesson
Corruption measurements and assessments can help programmers specify the problems they need to address and define the needs and gaps in the system, along with the opportunities and constraints for addressing them, but they cannot provide guidance regarding what reforms or programme approaches should be selected to address the problems. This requires other knowledge about reform models and experience.
C. Project implementation, monitoring and adapting
In the implementation stage, corruption information can help with two important tasks: 1) monitoring progress toward results and 2) checking assumptions in a programme’s theory of change. This information is critical to assuring the programme is on track and to adapting strategies and tactics if it is not.
Monitoring, evaluation and learning (MEL) is an extensive field that requires its own expertise, and some guidance on using corruption data in MEL already exists (see Trapnell 2015). Therefore, this section provides only a brief summary of some important lessons, along with some suggestions of types of information from the Annex 2 table that can be used at this stage of the programme cycle.
1. Key questions
Important questions for implementation, monitoring, and adapting, along with information sources to help answer them, are detailed in Annex 2. These include:
For results monitoring:
- Is the project having the expected effects? Are the projected inputs, outputs, and short- and medium-term outcomes materialising?
For checking assumptions and theory of change:
- Why are expected effects/impacts not taking place? How has the environment changed? Which assumptions in our theory of change are not proving true?
2. Relevant corruption measurements and assessments
For results monitoring, the relevant corruption measurements and assessments will depend on the outputs and outcomes defined at different levels of a programme’s results chain, which should be developed based on its theory of change. As demonstrated in Figure 3, the same information does not necessarily work at different levels.
- Outputs and short-term outcomes might be measured with administrative data or programme activity reporting that captures investments in change processes (number of people trained, agreements for collaboration established, etc.). Assessments or framework-based indices that reflect changes in de jure policies (eg, CPIA, Africa Integrity Indicators, Right to Information index, Open Budget Index) might provide independent documentation of short-term outcomes, if they are conducted frequently enough to reflect short time frames and are focused narrowly enough to be expected to reflect changes resulting from the programme’s activities.
- Medium-term outcomes should reflect changes in practices and experiences (de facto). These could be measured with administrative data, disaggregated index information that reflects de facto practice rather than only de jure legal and regulatory changes, or survey data that is appropriate to the level of the programming (eg, user surveys or targeted populations or regions). Perception data may be a poor measure of changes in the medium term, as more time may be required for experience to translate into perceptions (other factors not related to direct experience – such as news coverage – may also shape perceptions, making them an unreliable reflection of programme outcomes).
Figure 3: Types of corruption data for different levels of a results chain

Source: Trapnell 2015, p. 33.
For checking assumptions, a return to dynamic analysis is necessary. An effective approach could combine monitoring data with ongoing everyday political analysis936f5137e07c to assess why progress appears to be taking place or not and to evaluate whether the context has changed in ways that require adaptation of the programme. Corruption risk management (see Vital Question box on protecting funds) also requires identifying possible problems that a programme may encounter, so it is also a helpful tool for monitoring and adaptation.
Lessons
- Tools that help with diagnosis may not help with monitoring programme progress. The dynamic analyses that identify the opportunities and constraints for anti-corruption reforms do not normally provide ‘data points’ for monitoring the progress of a programme or reform process. Conversely, ‘data points,’ such as the number of negative audit findings or corruption complaints against a particular ministry may indicate where there is a corruption problem but not why it exists, what is the most likely reform path, or why a reform doesn’t seem to be succeeding. On the other hand, data points will probably tell you whether a reform effort targeting a particular problem is making a difference and may serve well as indicators the different outcome levels.
- Lesson: Causality and attribution problems make overall levels of corruption an inappropriate outcome or even impact-level indicator. The links between any given programme and overall levels of corruption are just too difficult to identify in most cases.
- Lesson: Measurements and other data that show changes in (de jure) frameworks (eg, laws, regulations, standards) can be good indicators for short-term outcomes, while information that reflects changes in (de facto) practices can be strong indicators of medium-term outcomes.
Vital question 5. How can we protect aid funds from risks of corruption or fraud?
While corruption risk management can and should cover a wider range of issues, including the risks that corruption poses to achievement of development objectives*, the focus is often on avoiding loss of funds to fraud or corruption. This question is typically addressed at the end of the design stage or start of the implementation stage, when considering the risks associated with a particular funds recipient or implementing mechanism.
This is not a question that corruption data can answer per se. Most often, this level of corruption risk analysis comes as a result of due diligence or fiduciary risk assessment (FRA) of the implementing organisation. Agencies typically have their own guidance and requirements for completing such assessments.** Due diligence and FRAs usually focus on a receiving organisation’s internal procurement and financial management practices, but do not necessarily assess the fiduciary risks presented by the broader environment. Broader corruption risk assessment can address these issues, and the questions and data sources are similar to those used at different stages of the project cycle.***
* See the elements of corruption risk management in the 2016 OECD Recommendation for Development Cooperation Actors on Managing the Risks of Corruption (http://www.oecd.org/corruption/oecd-recommendation-for-development-cooperation-actors-on-managing-risks-of-corruption.htm)
** Examples of agencies’ approaches are included in Hart 2016a and 2016b.
*** Johnsøn 2015 includes detailed discussion on types of data that can be used at different stages of risk assessment.
D. Project evaluation and learning
Evaluation and learning involve similar processes to monitoring and adapting, but typically take place at the mid-point or end of a programme. (Though assuring the evaluability of a programme, especially by developing a clear theory of change and results chain and establishing baseline data, must happen at the beginning).623337ff7b97
At the evaluation stage, longer-term outcomes or impact of a programme should be visible, and the indicators selected to demonstrate these changes should have been tested and adjusted throughout the programme. The purpose of evaluation is to establish whether these projected results were achieved, understand why they were or were not achieved, and/or learn what could or should have been done differently to achieve better results.
1. Key questions
Important questions for evaluation and learning, and information sources to help answer them, are detailed in Annex 2. In relation to the role of corruption measurements and assessment tools, key questions at this stage will be similar to those used in monitoring and adaptation, but with longer-term effects in mind:85a96ca24602
- Did the project have the expected effects? What impact has been achieved? (along with prior questions about short- and medium-term outcomes)
- Why did expected effects/impact emerge or not emerge? Was the initial problem analysis correct? Did adaptations respond effectively to changing conditions or learning opportunities? Did the environment change in important ways that affected outcomes?
- Were there unintended consequences of the programme?
2. Relevant corruption measurements and assessments
Corruption measurements used in the monitoring phase of a project will still be applicable for evaluation, but additional, higher-level results will be also be relevant, as demonstrated in Figure 3. If programme time frames are long enough, outcomes should reflect both changed practices (rather than just changed rules) and the impact of those changes, as articulated in the programme’s theory of change. Corruption measurements that may be relevant at this stage, if attribution can be established, include:
- Administrative data indicating fewer corruption complaints, funds saved in procurement processes, higher tax revenue associated with more effective tax collection processes, higher payment rates for water or energy utilities, more usage of health clinics (or possibly even better health outcomes), etc.
- Framework-based or sector/function index scores showing sustained better performance on implementation of anti-corruption laws, better perception of the business environment, etc. Better scores on de jure anti-corruption frameworks (eg, Africa Integrity Index, PEFA, Open Data) may constitute evidence of impact, depending on the scope and expectations of the programme. However, better performance in implementing those frameworks, and the results that follow from that implementation, is stronger evidence of impact.
- Survey data showing greater satisfaction with government’s efforts to address corruption, trust in targeted institutions (eg, judiciary or police), fewer bribes paid (eg, Global Corruption Barometer), etc.
- Sustained better performance in user surveys, citizen report cards, or community scorecards.
Evaluation and learning also aims to understand why results were or were not achieved, to assess the degree to which the results are linked to the programme activities (attribution), and to glean lessons for future programming. Establishing attribution is particularly challenging, but the link should be clear between the level of the results analysed and the programme activities. This can be achieved through the evaluation methodology itself (such as random control trials) or through a carefully developed theory of change and results chain indicators that clearly illustrate the connections between programme activities and measurements of results (see Søreide and Johnsøn 2013).
Additionally, dynamic analyses contain important clues about actors or other factors that could block reforms or help move them forward. Used retrospectively, or especially if updated intermittently, this type of analysis can point out where key opportunities were taken or where unexpected obstacles emerged. Data sources such as surveys or index scores might also be useful, for instance, by identifying mismatches between de jure reforms and de facto implementation that might explain poor outcomes. Similarly, gaps between high ratings on reform implementation and persistent low public perceptions can help flag programming lessons such as the need for a better communications strategy around the reform process.
Lessons
- Evaluation is most effective when it is planned for at the project design stage. A clear theory of change and a results chain with indicators, along with baseline data, are important early steps than make later evaluation more effective and informative (Søreide and Johnsøn 2013).
- Lesson: Multiple sources of information are usually needed to validate any given interpretations of results and create a more robust evidence base for the evaluation findings. (See [text box on PETS in Cambodia]) This ‘triangulation’ approach, especially using a combination of qualitative and quantitative data, is especially useful in interpreting progress on a complex phenomenon like corruption (Søreide and Johnsøn 2013, 30).
Multiple information sources needed: example of PETS in education in Cambodia
A Public Expenditure Tracking Survey (PETS) conducted in 2016 in the Cambodian education sector demonstrated that allocations of funds from the central government and a development partner generally arrived at schools in the full amount. However, the PETS also revealed that the funds typically arrived only after a significant delay, raising questions – but not answering them – about how schools financed their activities in the first term. PETS and the Quality of Service Delivery Surveys that typically accompany them must be triangulated with other sources of data to capture the full dynamics of budget expenditure in a sector.
Sources: World Bank, Cambodia Education Sector: Public Expenditure Tracking and Quality of Service Delivery Survey, Final Draft Report Sept 2017 (on file with author)
V. Essential lessons for using corruption measurements and assessments in development programming
Using corruption measurements and assessment tools in an informed way is not simple. Despite the number of such tools developed over the years, these sources rarely answer practitioners’ most pressing questions on their own. Development practitioners must still bring their own expertise and discernment to the task. This section highlights and consolidates a few lessons on these issues that appear in various forms throughout this guide.
A. Effective use of corruption measurements requires insight into the reasons corruption takes place
Measurements do not explain corruption. Understanding the factors that facilitate and drive corruption in a country, sector, institution, or public function is necessary in order to design reforms. (See [vital question box on what causes corruption]) While some measurements, such as indices of freedom of information or PEFA evaluations, can describe certain aspects of these facilitators and drivers, they may not explain how or why corruption happens in a specific context and thus be insufficient for determining the appropriate response.
B. Available measurements must not be used uncritically
No guide can provide a ‘recipe’ of corruption measurements and assessments to use at each point in development programming. Given the diversity of content and coverage, practitioners must learn and evaluate for themselves what each measurement includes and whether it is relevant for their country, programme, and phase of the programme cycle. Comparability over time or countries and links between programme activities and what a particular data source measures (attribution) are two of the most important issues to explore before using an existing data source. Using the guidance here (and suggestions in Annex 2) on types of measurements that are relevant to different questions, practitioners should review the menu of options in Annex 1 and then further explore sources that look promising. There is no substitute for this individual detective work.
C. Homegrown data adds depth, detail, and relevance
As highlighted throughout this guide, internationally-generated data sources seldom tell us what we need to know for programming. Many are too general, or not produced often enough, to be useful especially for monitoring, adapting, and evaluating programmes. ‘Homegrown’ data such as administrative statistics, targeted surveys, and other purpose-generated data, bespoke proxy indicators, and programme-specific indicators are almost always more likely to reflect the actual effects of a given programme than will international measures.
At the same time, international measures are attractive because they are readily available, perceived to be independent, and don’t require additional investments. The methods for collecting locally-generated information – like local surveys, civil society-led assessments, community scorecards, or Public Expenditure Tracking Surveys – can be expensive and hard to sustain. There are also challenges related to replicability and perhaps even unintended consequences (as when a corruption reporting website becomes a message board to share information on where one can pay the lowest bribe for a service) in locally-generated data that should be understood when data is developed (See Trapnell 2015, 97-100). Combining international and local sources can be a good option.
D. Dynamic analysis is essential to effective anti-corruption programming
Static measurements – snapshots of the system characteristics that facilitate corruption or of perceptions or experience of corruption at a given moment in time – cannot help practitioners explain why these conditions exist or what the challenges involved in changing them might be. Dynamic analyses of the drivers of corruption, informed by political economy considerations, are essential for the design and appraisal of programmes; and this kind of approach, even if less formal (like ‘everyday political analysis'), should continue throughout the programme. Such ongoing analysis is the only way to check assumptions about how change happens and to monitor whether and how facilitators and drivers have changed.
Annexes
Annex 1: Measurement and assessment tools table
Annex 2: Matching measurements and assessment tools to corruption diagnostic questions
- See especially the UNDP’s user’s guide to corruption indicators (Trapnell 2015), the Transparency International guide for monitoring corruption in the SDGs (Trapnell, Jenkins and Chêne 2017), and the U4 Expert Answer on corruption assessment tools (Wickberg 2016).
- Winners of U4’s ‘Proxy Challenge’ competition can be found at https://www.u4.no/topics/evaluation-and-measurement
- An example of the latter is the USAID ‘applied political economy analysis’ methodology (https://usaidlearninglab.org/library/applied-political-economy-analysis-pea-reference-materials)
- See for example, USAID studies on the political economy of service delivery in Afghanistan (http://democracyinternational.com/media/PEA%20of%20Afghanistan%27s%20Service%20Delivery%20Capacity.pdf) and of issues in the reform of tuberculosis treatment in Ukraine (https://usaidlearninglab.org/sites/default/files/resource/files/acfrogaqfoll1qnksiks540c8rjsxjpfccabcxq6t6ccysnlu0tcuiklohnknoqwer0ixjgtvca8-4o5hv6hj6xgpy4n5fortzii3sbtu0xi_24tphypofiyyqhx6gk.pdf).
- For example, the Worldwide Governance Indicators and the Corruption Perception Index can be used to sort countries into ‘red-yellow-green’ categories, but the difference between a country that scores 45 and one that scores 58 out of 100 may be negligible. Rankings, as opposed to scores, are especially problematic because one country’s movement on the scale will affect another’s ranking, without any change (positive or negative) in the second country’s corruption situation.
- For more about coalitions of shared interests around anti-corruption reform and enforcement, see https://ace.soas.ac.uk/486-2/.
- See http://www.dlprog.org/publications/everyday-political-analysis.php
- Søreide and Johnsøn 2013 provide an overview of evaluation approaches, methods for improving evaluability, and types of data that can be used in different types of evaluations. Trapnell 2015 provides an overview of theories of change and results chains, along with suggestions of types of data relevant to different types of reforms (pp. 31-40).
- These questions do not address all the areas included in standard evaluation criteria, such as those of the OECD Development Assistance Committee, as this paper addresses only the role of corruption measurements and assessments in evaluation. Questions included here will mainly speak to the Effectiveness and Impact elements of the OECD framework.
- https://www.transparency.org/files/content/feature/Global_Corruption_Barometer_Core_Questionnaire.pdf