There has been a surge of corruption indicators and methodologies in the past decade, and the Vienna Principles now provide a welcome underpinning to…
Blog
Measuring progress on Sustainable Development Goal 16.5
Precious few countries provide the necessary data on corruption and bribery. Furthermore, Sustainable Development Goal 16.5 is too vague and the indicators are too narrow. However, the United Nations Office on Drugs and Crime has developed materials to help countries collect and report data on bribery incidence.

This is the second piece in a blog series on anti-corruption measurement tools and their application in practice. Contributors include leading measurement, evaluation, and corruption experts invited by U4 to share up-to-date insights during 2024–2025.
Sustainable Development Goal (SDG) 16.5 exhorts countries to ‘substantially reduce corruption and bribery in all their forms’. To measure compliance with this goal, the United Nations Office on Drugs and Crime (UNODC) has established two indicators:
- 16.5.1 Proportion of persons who had at least one contact with a public official and who paid a bribe to a public official, or were asked for a bribe by those public officials, during the previous 12 months.
- 16.5.2 Proportion of businesses that had at least one contact with a public official and that paid a bribe to a public official, or were asked for a bribe by those public officials, during the previous 12 months.
These measure bribery among ‘natural persons’ and ‘legal persons’ (ie, firms) that have had contact with public authorities. The bribery incidence rate measures per-user (not per-use) incidence.
How do countries measure progress on SDG 16.5?
National statistical agencies (or other national authorities) ask individuals and representatives of firms to complete surveys to gather representative sample data at national and sub-national (state, province, or county) levels. Often these surveys contain questions that cover bribery incidences, and perceptions of corruption. For bribery incidences, respondents are usually asked if they have had contact with a public servant in the previous year; better surveys ask about contact with specific services, such as the police, healthcare, and education, in the spirit of the Global Corruption Barometer (GCB). Then, respondents who had contact with a service are asked if a bribe/extra-official payment/informal payment or favour was made/expected/requested/required.
The bribery incidence rate is calculated as follows:
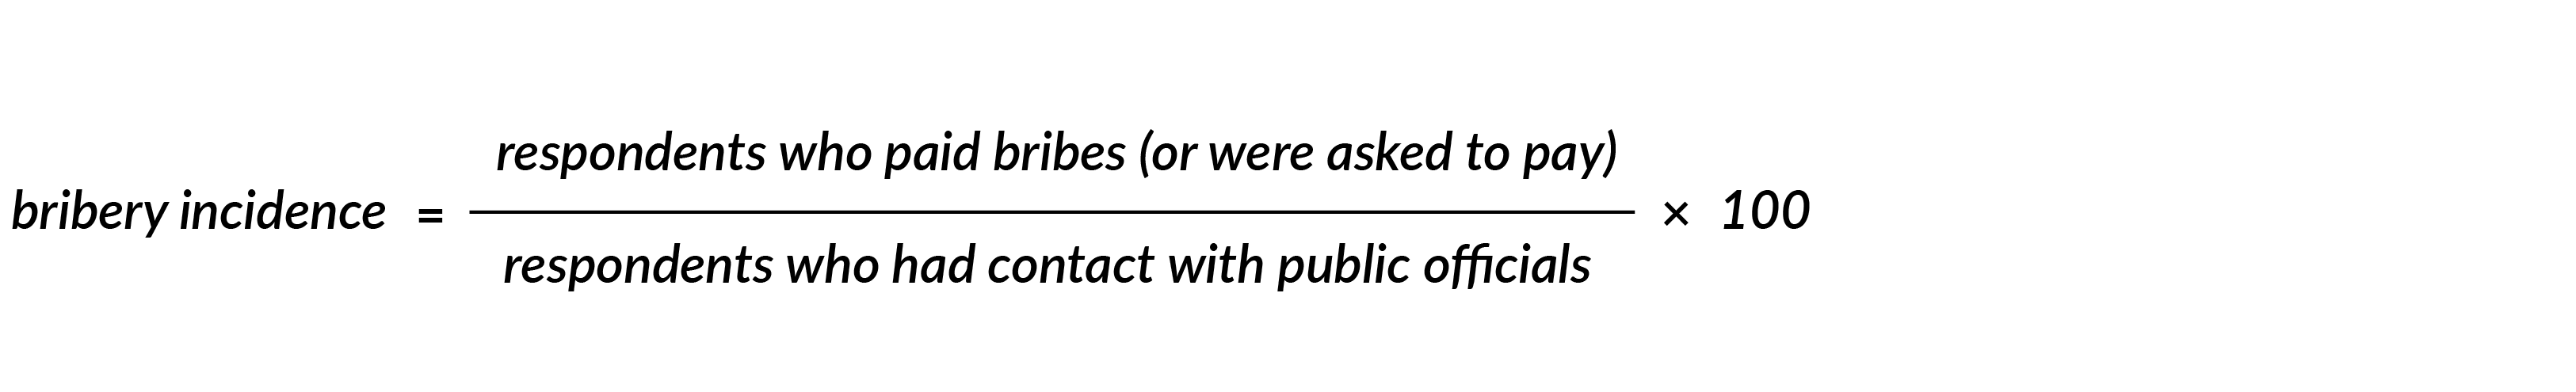
Collected data are validated by UNODC in the latter half of the year as part of the United Nations Surveys on Crime Trends and Operations of Criminal Justice Systems (UN-CTS). UNODC makes data available in the second quarter of the following year.
To support countries, in 2018, UNODC (with other UN agencies) published a manual on administering and analysing corruption surveys, followed by a sample questionnaire in 2022. The sample questionnaire covers indicator 16.5.1; it proposes 15 types of public authorities to ask bribery questions about (with the option to add others). The surveys should include demographic data so statistics can be disaggregated by respondents’ sex, age, and educational attainment, as well as by the type of official receiving or requiring a bribe. The UN/UNODC’s manual and sample questionnaire make it easier for countries to comply with current data provision requirements, if there is political will to do so.
Although some countries also collect similar data from businesses, all the data for indicator 16.5.2 are taken from the World Development Indicators, derived from the World Bank’s Enterprise Surveys. (For the full indicator metadata, see UNODC documentation.)
Mixed progress in reducing bribery
There are several limitations to the current measurement of progress on SDG 16.5:
- The documentation does not define ‘substantially’ or ‘all their forms’. Although bribery is the most universally accepted type of corruption, there are many forms of corruption beyond bribery. Furthermore, it is unclear what a ‘substantial’ improvement would entail. Consequently, no report to date has provided statistics on the number of countries that have fulfilled this vague goal.
- Data are sparse. UNODC notes that ‘more than 120 countries have at least one data point on bribery prevalence based on a nationally representative survey.’ In fact, 140 countries have at least one data point, but only 25 countries have provided data for indicator 16.5.1; the remaining datasets come from GCB and UNODC analyses. To determine a ‘substantial’ reduction, at least two data points are necessary, a condition fulfilled by only 63 countries between 2015 and 2022. (Kudos to Peru, which provided data annually from 2005 to 2020.) So, even with complementary data, there is only information to calculate a change in individual corruption for 63 countries.
- There is no established base year for comparison. While other SDGs establish a base at 2015, 2010, or another year, SDG 16.5 does not.
Applying an arbitrary line for what constitutes a 'substantial reduction in bribery' is unfair to any country that had a low bribery rate at the start.
Individual bribery rates: Indicator 16.5.1
Assuming a base year of 2015, we can calculate the changes in individual bribery rates (indicator 16.5.1) from 2015 (or the first year available) to the most recent rate (Figure 1), revealing that 24 countries have reduced bribery, 35 have worsened, and four have stayed the same. The most improved (largest fall in bribery rates) are Viet Nam (-50), the Dominican Republic (-42), and India (-30).
Which of these countries reduced corruption ‘substantially’? A clear but subjective answer might be ‘those countries that reduced bribery incidence by 30 percentage points or more’. However, this arbitrary line is unfair to any country that had a low bribery rate at the start. Another potential definition would involve a reduced bribery rate of a certain percentage – say, 50% or 25%.
Figure 1: Change in bribery incidence, 2015 to present

Source: Author’s calculations using data from UNODC.
Figure 2 shows countries’ improvements, in percentages. For example, Estonia had a bribery rate of 3.63% in 2015 and 1% in 2021; the decrease of 2.63 percentage points represents a reduction of 72.45% compared to the 2015 rate. If we set the bar at a 50% reduction, then only nine countries have met the target for indicator 16.5.1.
Figure 2. Percentage change in indicator 16.5.1
Source: Author’s calculations using data from UNODC.
Business bribery rates: Indicator 16.5.2
SDG data for indicator 16.5.2 are drawn from the World Development Indicators (WDI). This represents ‘bribery incidence (% of firms experiencing at least one bribe payment request)’. Of the 107 countries that have data, only four countries have sufficient information (for two years), to calculate progress on indicator 16.5.2.
In Egypt, the bribery rate for firms fell 10.24 percentage points, from 15.17% to 4.93%, between 2016 and 2020. From 2015 to 2019, Malaysia reduced the rate of bribery experienced by firms by 27.78 percentage points, from 28.21% to 0.43%, while Timor-Leste dropped this rate by 34.35 percentage points between 2015 and 2021, from 44.2% to 9.85%. However, in Laos, firms’ bribery incidence rose by 23.91 percentage points in only two years, from 16.38% in 2016 to 40.29% in 2018.
It is imperative to further incentivise countries to self-report, or to expand Global Corruption Barometer coverage and frequency.
Improving corruption indicators for the future
The current measures for both SDG indicators are unsatisfactory. One limitation of indicator 16.5.1 is relying on national statistical agencies for data. UNODC has used data from the GCB, but this survey is published only every other year, at best, and covers just a subset of countries. There are also discrepancies between the GCB’s and national figures. For example, in 2019, the GCB reported that Mexico had a bribery incidence rate of 34%, but national statistics recorded the rate as 15.7%. The number used affects the progress calculated. Therefore, it is imperative to further incentivise countries to self-report, or to expand GCB coverage and frequency. To achieve this, UNODC or individual countries might consider contributing to GCB funding.
Measuring indicator 16.5.2 is also limited by using the World Bank’s Enterprise Surveys – which only include one year of data on almost all countries. UNODC should co-fund the surveys each year, and request that all countries self-report business-related bribery incidences.
If we truly want to ‘substantially reduce corruption and bribery in all their forms’, we need to define ‘substantially’, expand the current narrow interpretation of ‘all their forms’ to include other types of corruption, establish a base year, and collect data more frequently. My co-authors and I have developed an index that addresses these issues: the Multidimensional Index of Progress Against Corruption (MIPAC).
Anti-corruption measurement series
This blog series looks at recent anti-corruption measurement and assessment tools, and how they have been applied in practice at regional or global level, particularly in development programming.
Contributors include leading measurement, evaluation, and corruption experts invited by U4 to share up-to-date insights during 2024–2025. (Series editors are Sofie Arjon Schütte and Joseph Pozsgai-Alvarez).
Blog posts in the series
- One year on: The Vienna Principles for the measurement of corruption (Elizabeth David-Barrett) 2 Sep 2024
- (This post) Measuring progress on Sustainable Development Goal 16.5 (Bonnie J. Palifka) 1 Oct 2024
Sign up to the U4 Newsletter to get updates, or follow us on Twitter | Linkedin | Facebook.
Disclaimer
All views in this text are the author(s)’, and may differ from the U4 partner agencies’ policies.
This work is licenced under a Creative Commons Attribution-NonCommercial-NoDerivatives 4.0 International licence (CC BY-NC-ND 4.0)